Unlock a world of possibilities! Login now and discover the exclusive benefits awaiting you.
- Qlik Community
- :
- All Forums
- :
- QlikView App Dev
- :
- Re: How do I compare two separate selections?
- Subscribe to RSS Feed
- Mark Topic as New
- Mark Topic as Read
- Float this Topic for Current User
- Bookmark
- Subscribe
- Mute
- Printer Friendly Page
- Mark as New
- Bookmark
- Subscribe
- Mute
- Subscribe to RSS Feed
- Permalink
- Report Inappropriate Content
How do I compare two separate selections?
Is there any way to compare two separate selections? Let me put it this way...
There are two groups. The user gets to pick which selection they want in each group.
I have a list box with different people:
Person A
Person B
Person C
Person D
Person E
I want the user to select one or more people to be in "Group 1"
Then I want the user to select one or more people to be in "Group 2"
After both groups are selected I want the user to be able to see the performance of each group side by side among all charts and graphs. It would also be nice if they could modify the groups live. This could probably be done with variables and user input of some sort but I just can't seem to figure out an easy way. I really appreciate any help!
Accepted Solutions
- Mark as New
- Bookmark
- Subscribe
- Mute
- Subscribe to RSS Feed
- Permalink
- Report Inappropriate Content
Hi Shane,
First create two alternet states
Go to Settings->Document Properties->General->Alternete Sates
Add Group1 and Group2. then
Create two same list box.
Add that 1st list box Group1 as Alternate states and 2nd list box Group2 as Altenate states.
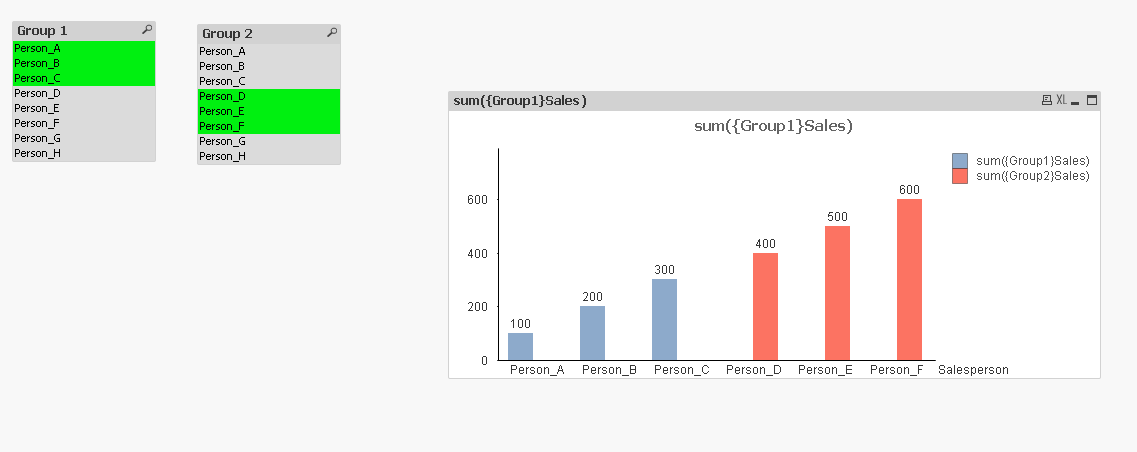
Create one bar chart add the list box field as Dimension and two measure like
sum({Group1} Sales)
sum({Group2} Sales)
select first list box Person_A,Person_B,Person_C and
Second List box Person_D,Person_E,Person_F
output look like below
PFA below app
Regards,
Vishal
- Mark as New
- Bookmark
- Subscribe
- Mute
- Subscribe to RSS Feed
- Permalink
- Report Inappropriate Content
You probably need: Alternate State
Check this too: QlikView Alternate States Use-Cases
- Mark as New
- Bookmark
- Subscribe
- Mute
- Subscribe to RSS Feed
- Permalink
- Report Inappropriate Content
Why it's among all charts and graphs?
The above can be achievable by using Alternate States.
Two List boxes for each group representation / selection and two charts for representation of each group.
Selection is individual. But for among all charts, it's more trivial.
https://help.qlik.com/en-US/qlikview/November2017/Subsystems/Client/Content/Alternate%20States.htm
- Mark as New
- Bookmark
- Subscribe
- Mute
- Subscribe to RSS Feed
- Permalink
- Report Inappropriate Content
Hi Shane,
First create two alternet states
Go to Settings->Document Properties->General->Alternete Sates
Add Group1 and Group2. then
Create two same list box.
Add that 1st list box Group1 as Alternate states and 2nd list box Group2 as Altenate states.
Create one bar chart add the list box field as Dimension and two measure like
sum({Group1} Sales)
sum({Group2} Sales)
select first list box Person_A,Person_B,Person_C and
Second List box Person_D,Person_E,Person_F
output look like below
PFA below app
Regards,
Vishal
- Mark as New
- Bookmark
- Subscribe
- Mute
- Subscribe to RSS Feed
- Permalink
- Report Inappropriate Content
Thank you! This is exactly what I was looking for.