Unlock a world of possibilities! Login now and discover the exclusive benefits awaiting you.
- Qlik Community
- :
- All Forums
- :
- QlikView App Dev
- :
- How do I create a bar chart using only expressions...
- Subscribe to RSS Feed
- Mark Topic as New
- Mark Topic as Read
- Float this Topic for Current User
- Bookmark
- Subscribe
- Mute
- Printer Friendly Page
- Mark as New
- Bookmark
- Subscribe
- Mute
- Subscribe to RSS Feed
- Permalink
- Report Inappropriate Content
How do I create a bar chart using only expressions on the axes?
Hi,
I'm fairly new to QlikView and I'm really struggling with creating a bar chart using only 2 expressions and no dimensions. I really hope someone can help me. I've tried so many different ways, (including, changing one of the expressions to a dimension), but really there are too many to list here. Instead, let me show you what I'm trying to do in the hope that someone can offer me a solution.
Summary:
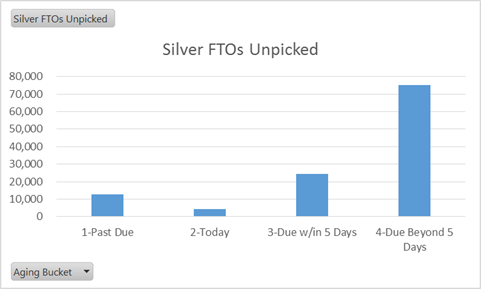
I'm trying to graphically show how open sales orders are aged so that we can get a handle on backlog and plan future resource requirements. One of the ways we want to do this is to see the quantity of metal on open sales orders and how much of that quantity is due to ship, and/or ready to ship, based on some pre-defined aging buckets.
Directly below is ultimately what I want the chart to look like. Below that, I've also show a screen shot of what the straight table data looks like and below that I have given a brief overview of what's represented in that data. I'm also attaching an excel file with the desired chart and data table (not sure if that will help, but I'm attaching anyway).
Any help is greatly appreciated.
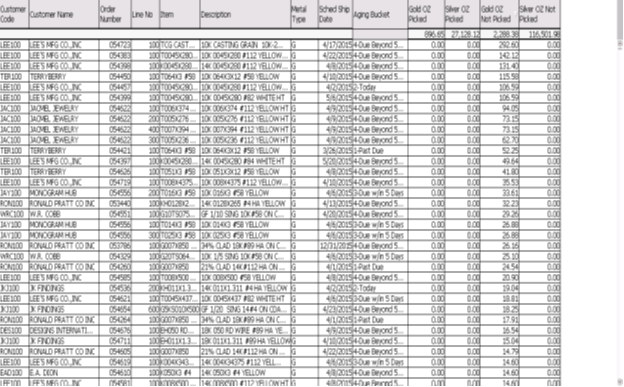
Dimensions:
Customer Code and Customer Name are dimensions from the SOHeader table; Order Number, Line No, Item, Description and Sched Ship Date are dimensions from the SOLines table; Metal Type is from the Qlty_Tbl table.
Expressions:
Aging Bucket is an expression that references a variable which calculates the difference in the number of days between today’s date and the sched ship date. Based on that number of days, it assigned to an aging category/bucket in the variable. Here is the variable formula:
if(SCHEDULED_SHIP_DATE<$(vToday),'1-Past Due',if(SCHEDULED_SHIP_DATE=$(vToday),'2-Today',if(SCHEDULED_SHIP_DATE>$(vToday) AND SCHEDULED_SHIP_DATE<($(vToday)+6),'3-Due w/in 5 Days','4-Due Beyond 5 Days')))
All the remaining columns are expressions that reference a variable. For example, Silver OZ Not Picked has a formula as follows:
if (Qlty_Tbl.METAL_TYPE='S' AND QTY_PICKED=0,QTY_ORDERED*Products.QUALITY_CODE1_WEIGHT*Qlty_Tbl.FINENESS_FACTOR*Qlty_Tbl.FINENESS_MULT,0)
For Picked OZ, the only part of the formula that changes is the QTY_PICKED<>0. For Gold versus Silver, the only part of the formula that changes is Qlty_Tbl.METAL_TYPE=’G’.
- Mark as New
- Bookmark
- Subscribe
- Mute
- Subscribe to RSS Feed
- Permalink
- Report Inappropriate Content
You could add the Aging Bucket calculation into your LOAD Script, then this calculation would become a dimension.
- Mark as New
- Bookmark
- Subscribe
- Mute
- Subscribe to RSS Feed
- Permalink
- Report Inappropriate Content
Thanks. I don't have access to the script which is why I did it as a variable. In any event, when I change the chart to a stacked versus grouped column it works as expected.