Unlock a world of possibilities! Login now and discover the exclusive benefits awaiting you.
- Qlik Community
- :
- All Forums
- :
- QlikView App Dev
- :
- How do I display both x axis labels on a bar chart...
- Subscribe to RSS Feed
- Mark Topic as New
- Mark Topic as Read
- Float this Topic for Current User
- Bookmark
- Subscribe
- Mute
- Printer Friendly Page
- Mark as New
- Bookmark
- Subscribe
- Mute
- Subscribe to RSS Feed
- Permalink
- Report Inappropriate Content
How do I display both x axis labels on a bar chart ?
Hi,
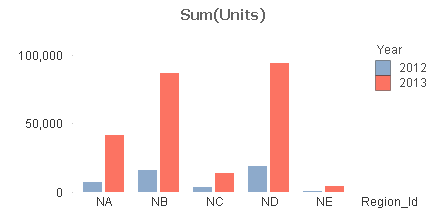
I have a bar chart which is summing a value against two dimensions (region and year). The graph displays a vertical column for each year for each region.
I can show the legend for the 'Region' dimension, but not for the 'Year'. I've checked the 'Show legend' checkbox for both dimensions but only the region values are displayed on the chart.
is there anyone who can help me with this please.
Thanks
Mo
Accepted Solutions
- Mark as New
- Bookmark
- Subscribe
- Mute
- Subscribe to RSS Feed
- Permalink
- Report Inappropriate Content
The legend for the second dimension will be showed to the right in the graph.
HIC
- Mark as New
- Bookmark
- Subscribe
- Mute
- Subscribe to RSS Feed
- Permalink
- Report Inappropriate Content
The legend for the second dimension will be showed to the right in the graph.
HIC
- Mark as New
- Bookmark
- Subscribe
- Mute
- Subscribe to RSS Feed
- Permalink
- Report Inappropriate Content
use Region as first dimension and year as second dimension
So Region will sit in horizontal position and year will sit in vertical position .use one expression so each dimension eg region as South .for south u will see two bars
u will see the two bar one for current year and another one for last year