Unlock a world of possibilities! Login now and discover the exclusive benefits awaiting you.
- Qlik Community
- :
- All Forums
- :
- QlikView App Dev
- :
- Re: How do I show 2 'y' axes on a line chart ?
Options
- Subscribe to RSS Feed
- Mark Topic as New
- Mark Topic as Read
- Float this Topic for Current User
- Bookmark
- Subscribe
- Mute
- Printer Friendly Page
Turn on suggestions
Auto-suggest helps you quickly narrow down your search results by suggesting possible matches as you type.
Showing results for
Not applicable
2015-09-01
05:47 AM
- Mark as New
- Bookmark
- Subscribe
- Mute
- Subscribe to RSS Feed
- Permalink
- Report Inappropriate Content
How do I show 2 'y' axes on a line chart ?
Hi All,
I have a line chart with two expressions displaying two lines (naturally!).
I want to show a left 'y' axis scaled in £ from 0 to 1000 for the first expression, and a right 'y' axis from 0 to 100 (representing points) for the second expression. Is this possible ?
Thanks
MV
- Tags:
- new_to_qlikview
1,223 Views
1 Solution
Accepted Solutions
Not applicable
2015-09-01
06:41 AM
Author
- Mark as New
- Bookmark
- Subscribe
- Mute
- Subscribe to RSS Feed
- Permalink
- Report Inappropriate Content
1,084 Views
5 Replies
Specialist III
2015-09-01
06:00 AM
- Mark as New
- Bookmark
- Subscribe
- Mute
- Subscribe to RSS Feed
- Permalink
- Report Inappropriate Content
 go to axes click secon expression and click on position right
Creator II
2015-09-01
06:01 AM
- Mark as New
- Bookmark
- Subscribe
- Mute
- Subscribe to RSS Feed
- Permalink
- Report Inappropriate Content
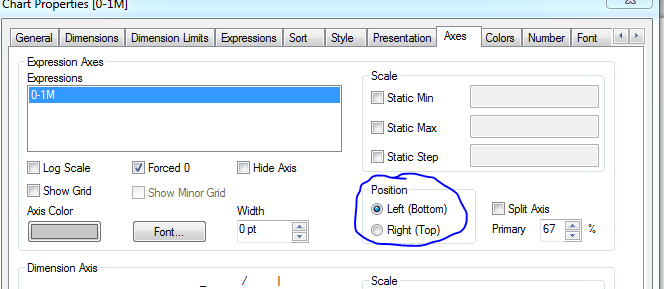
In the chart properties, axes tab: for each expression you can select a position (either left of right).
1,084 Views
MVP
2015-09-01
06:01 AM
- Mark as New
- Bookmark
- Subscribe
- Mute
- Subscribe to RSS Feed
- Permalink
- Report Inappropriate Content
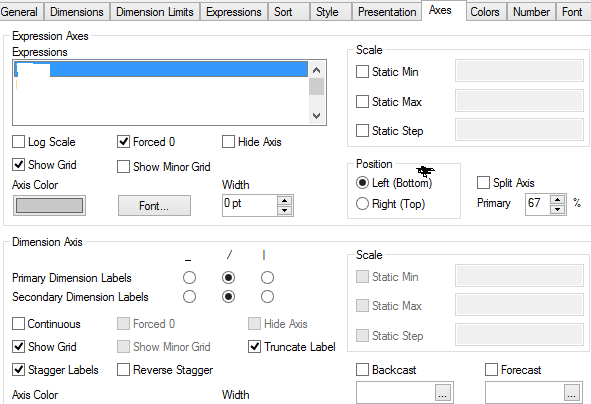
Move one of the dimension to the other side on the Axis tab:
1,084 Views
Partner - Master
2015-09-01
06:03 AM
- Mark as New
- Bookmark
- Subscribe
- Mute
- Subscribe to RSS Feed
- Permalink
- Report Inappropriate Content
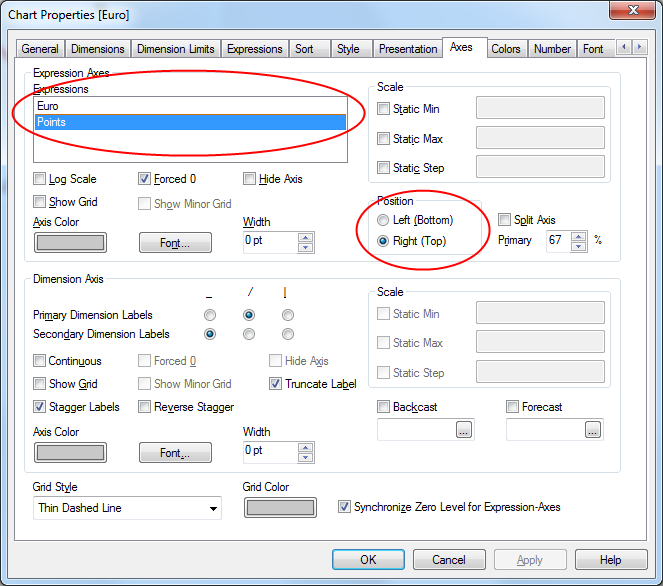
Looking for something like this?
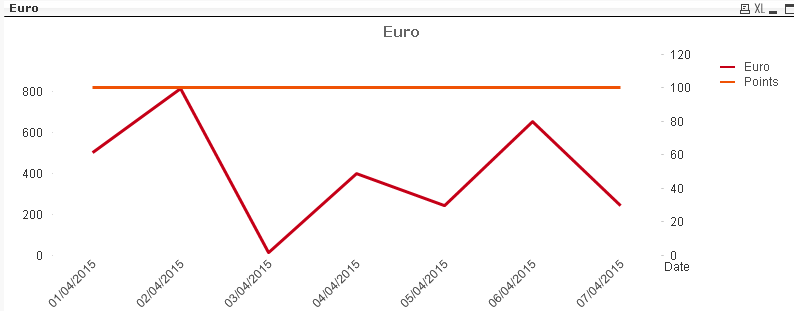
Set the second expression to the right side
Not applicable
2015-09-01
06:41 AM
Author
- Mark as New
- Bookmark
- Subscribe
- Mute
- Subscribe to RSS Feed
- Permalink
- Report Inappropriate Content
That's perfect Piet. Exactly what I wanted.
Thanks
MV
1,085 Views