Unlock a world of possibilities! Login now and discover the exclusive benefits awaiting you.
- Qlik Community
- :
- All Forums
- :
- QlikView App Dev
- :
- How is Qlikview treating my date/numbers?
- Subscribe to RSS Feed
- Mark Topic as New
- Mark Topic as Read
- Float this Topic for Current User
- Bookmark
- Subscribe
- Mute
- Printer Friendly Page
- Mark as New
- Bookmark
- Subscribe
- Mute
- Subscribe to RSS Feed
- Permalink
- Report Inappropriate Content
How is Qlikview treating my date/numbers?
I do not understand what is happening here - so going quietly crazy  Jo
Jo
| Count({$}[UtilPatName]) | QCL - CT | START - QCL | rawQCLDate - rawCT |
| 1.0 | 13.0 | 5.5 | 13.0 |
| 1.0 | 19.8 | 0.6 | 19.8 |
| 1.0 | 70.7 | 0.6 | 8.8 |
3.0 | 103.5 | -Qlikview will not give me a total | -Qlikview will not give me a total |
| 3.0 | 103.5 | 6.7 | 41.6 |
- Tags:
- new_to_qlikview
- Mark as New
- Bookmark
- Subscribe
- Mute
- Subscribe to RSS Feed
- Permalink
- Report Inappropriate Content
What is your expression for START - QCL and rawQCLDate - rawCT?? I think you should be able to use Aggr function to get a total you desire(if it is a pivot table):
=Sum(Aggr(YourCurrentExpression, YourDimensions))
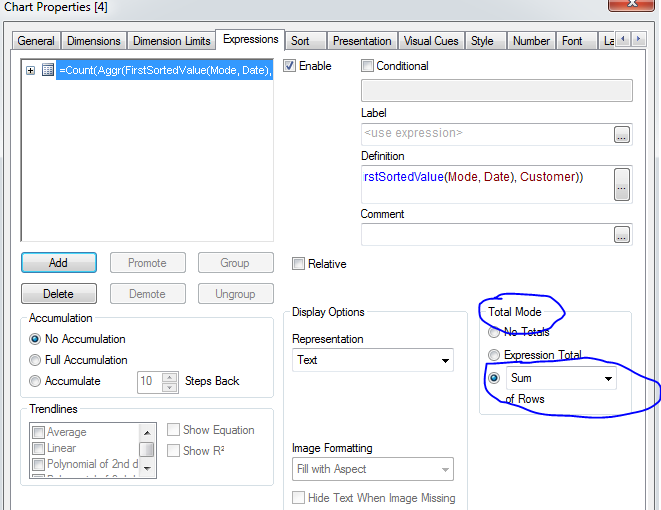
and use Sum as total mode for straight table:
- Mark as New
- Bookmark
- Subscribe
- Mute
- Subscribe to RSS Feed
- Permalink
- Report Inappropriate Content
when i use (qclDate - ctDate) - right answer, when i use sum(qclDate - ctDate) - wrong answer.
as soon as I try to do an expression apart from a simple subtraction - wrong answer
- Mark as New
- Bookmark
- Subscribe
- Mute
- Subscribe to RSS Feed
- Permalink
- Report Inappropriate Content
So why can't you use it without sum if it gives you the correct answer.
Best,
Sunny
- Mark as New
- Bookmark
- Subscribe
- Mute
- Subscribe to RSS Feed
- Permalink
- Report Inappropriate Content
use
rangesum (qclDate,- ctDate)
hth
Sasi
- Mark as New
- Bookmark
- Subscribe
- Mute
- Subscribe to RSS Feed
- Permalink
- Report Inappropriate Content
=Sum(Aggr(qclDate - ctDate, <your table dimensions>)
<your table dimensions> is a comma separated list of all the dimensions in the table. They must be fields, not calculated dimensions.
- Mark as New
- Bookmark
- Subscribe
- Mute
- Subscribe to RSS Feed
- Permalink
- Report Inappropriate Content
You must use an aggregation function (e.g. Sum(START-QCL) ) to define what QlikView should do if there are several records per dimension value. See Use Aggregation Functions!
Further, the totals in QlikView are by default not the sum of rows. Rather, it is the expression calculated over the entire data set. The difference is when one record in the source data contributes to two lines in the chart - should this record then be double counted or not? Usually it should not, and then you should use Expression total.
HIC
- Mark as New
- Bookmark
- Subscribe
- Mute
- Subscribe to RSS Feed
- Permalink
- Report Inappropriate Content
Hi Henric and Jonathon - I cannot find the correct button for both of you ... the only action I can get is Helpful??? and Like works!
- Mark as New
- Bookmark
- Subscribe
- Mute
- Subscribe to RSS Feed
- Permalink
- Report Inappropriate Content
Sorry everybody, but I thought I wrote this 10 mins ago... but I could not find it...
I think I have done something really silly- but cannot check till Tuesday.
aggr(sum((rawQCLDate - rawCT)),UtilClinic) - versus sum(aggr(
I hope it is that simple ...
Jo
I am going crazy trying to see how QlikView is treating my numbers. I am wondering if the answer is set analysis. I thought I had solved my problem using the function Aggr - however - it works on an exmaple I made up but not in real life. Sorry not sure how to get the info here ...
Jo
rawQCLDate - rawCTDate = 8.8 (correct) (THIS WILL NOT TOTAL in QLIKVIEW)
sum({$}(rawQCLDate - rawCT)) = 77 (not even sure where that number is coming from
aggr(sum((rawQCLDate - rawCT)),UtilClinic) - gives me the same answer
| UtilClinic | UtilPatName | URN | CT | QCL | Start Date | Count({$}[UtilPatName]) | QCL - CT | START - QCL | rawQCLDate - rawCT |
| Neuro, | namex | 154100216 | 28/05/2015 11:30 | 10/06/2015 11:22 | 16/06/2015 0:00 | 1.0 | 13.0 | 5.5 | 13.0 |
| Neuro, | namey | 151103763 | 9/06/2015 15:30 | 29/06/2015 10:40 | 30/06/2015 0:00 | 1.0 | 19.8 | 0.6 | 19.8 |
| Neuro, | namez | 94100386 | 1/06/2015 13:00 | 10/06/2015 9:00 | 11/06/2015 0:00 | 1.0 | 70.7 | 0.6 | 8.8 |
| Total | 3.0 | 103.5 | - | - | |||||
| WHAT THE ANSWER SHOULD BE | 3.0 | 103.5 | |||||||