Unlock a world of possibilities! Login now and discover the exclusive benefits awaiting you.
- Qlik Community
- :
- All Forums
- :
- QlikView App Dev
- :
- How much profit is lost by loosing contracts in th...
- Subscribe to RSS Feed
- Mark Topic as New
- Mark Topic as Read
- Float this Topic for Current User
- Bookmark
- Subscribe
- Mute
- Printer Friendly Page
- Mark as New
- Bookmark
- Subscribe
- Mute
- Subscribe to RSS Feed
- Permalink
- Report Inappropriate Content
How much profit is lost by loosing contracts in the accumulated value of X revenue
Hi,
I have the problem that I wanted to understand the impact of one KPI depending on a selection on another KPI. I have created an example based on Revenue and Profit (which is a reduced complexity).
Imagine we have contracts which generate revenue for certain products and certain customers over certain periods....Now we want to identify how much profit we loose if we terminate contracts. But we want to create two extremes: At first terminate all high revenue volume contracts until a certain threshold is reached and secondly terminating all low volume contracts until a certain revenue threshold is reached.
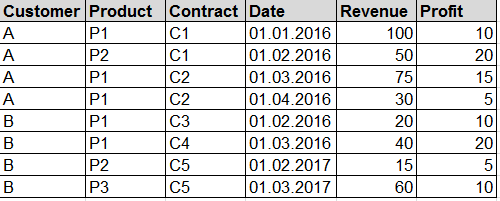
So based on the data example above I am looking for an expression statement which provides me:
1) the profit affected selecting all contracts sorted ascending by revenue until the accumulated revenue X is reached?
2) the profit affected selecting all contracts sorted descending by revenue until the accumulated revenue X is reached?
So if, for instance X would be 160 I would expect:
1) Contract C3,C4,C5 and C2 would be selected because the revenue sum of these contracts would reach >160. The profit affected would be 65.
2) Contract C1 and C2 would be selected because the revenue sum of these contracts would reach >160. The profit affected would be 50.
I was thinking of using the function Firstsortedvalue somehow but I simply have no idea how to do it or I may be on the totally wrong path...
Thanks for any help!
Marcel
- Mark as New
- Bookmark
- Subscribe
- Mute
- Subscribe to RSS Feed
- Permalink
- Report Inappropriate Content
If you are using a recent version of Qlikview, you can use the sortable aggr() function to return the contracts required and then calculated their aggregtaed profit
Recipe for a Pareto Analysis – Revisited
I don't like typing numbers looking at a screentshot, so no sample file from my side 
(I mean, it's better to post a table that can be copied & pasted to the script editor or a input file if you want people to help you with your issue. Makes it easier to play around).
edit: But without any testing (see above) it could look like
=Sum(
Aggr(
If(Rangesum(Above(Sum({1} Revenue),1,RowNo()))<160, Sum(Profit) ),
(Contract,(=Sum({1} Revenue),Desc))
)
)
- Mark as New
- Bookmark
- Subscribe
- Mute
- Subscribe to RSS Feed
- Permalink
- Report Inappropriate Content
You can create a button and set the action for that as Pareto Select as shown in the below image so it will show you the Customers who are contributing for your 80% Revenue. if you Check (Select Complement) then you can see Customers who are contributing for 20% of Revenue. (Pareto Button or ABC Analysis or 80-20 Analysis)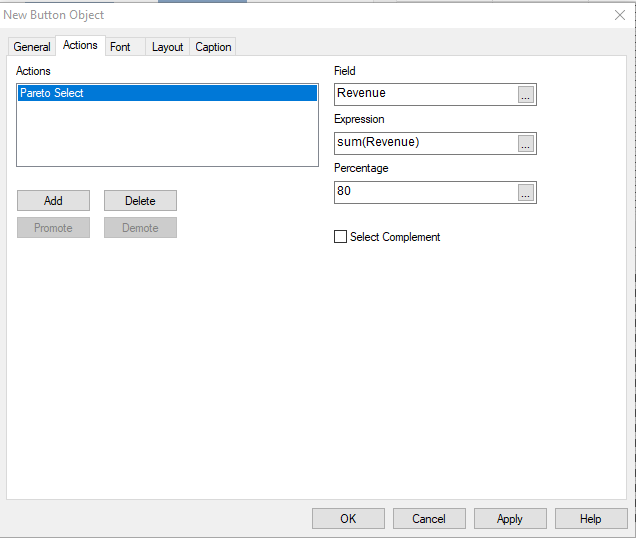
- Mark as New
- Bookmark
- Subscribe
- Mute
- Subscribe to RSS Feed
- Permalink
- Report Inappropriate Content
Thanks Stefan and Mouna. I think I will try Stefans expression as I finally need to have a chart showing both extremes by different breakdowns, e.g. product or Month or Year or Customer, etc.
@Stefan: You are right, adding an Excelfile would be more beneficial than copying a picture. I will add the Excelfile in case somebody has additional ideas....
I will keep you posted and might come back with further questions on this. Anyhow, many thanks to you!
Marcel
- Mark as New
- Bookmark
- Subscribe
- Mute
- Subscribe to RSS Feed
- Permalink
- Report Inappropriate Content
Just note that the sortable aggr() functions is only available in recent versions of QV12 and QlikSense (e.g. not in QV11).
- Mark as New
- Bookmark
- Subscribe
- Mute
- Subscribe to RSS Feed
- Permalink
- Report Inappropriate Content
Damn.... We are still using QV11 on our servers....Is there any way to do it in QV11?
If I would just get the number of contracts that I have to consider until the threshold is reached (e.g. put this in a variable)... I might be able to use a rank function to select any contract with a rank on sales lower than the value in this variable....
Would you think this could work?
- Mark as New
- Bookmark
- Subscribe
- Mute
- Subscribe to RSS Feed
- Permalink
- Report Inappropriate Content
Maybe a pareto select action might work, have a look at
Background color depending of accumulated sum(sales)
or