Unlock a world of possibilities! Login now and discover the exclusive benefits awaiting you.
- Qlik Community
- :
- All Forums
- :
- QlikView App Dev
- :
- How to Calculate the Last three Months Sales
- Subscribe to RSS Feed
- Mark Topic as New
- Mark Topic as Read
- Float this Topic for Current User
- Bookmark
- Subscribe
- Mute
- Printer Friendly Page
- Mark as New
- Bookmark
- Subscribe
- Mute
- Subscribe to RSS Feed
- Permalink
- Report Inappropriate Content
How to Calculate the Last three Months Sales
Could you help to tell me how to write the express to Calculate the Last three Months sales?
For example:
The 2016/1 sales amount is 100
The 2015/12 sales amount is 200
The 2015/11 sales amount is 300
The 2015/10 sales amount is 400
Select (2016 -1)
The Result:
Year Month Sales
2016 1 100+200+300
Select (2015 -12)
The Result:
Year Month Sales
2015 12 200+300+400
- « Previous Replies
-
- 1
- 2
- Next Replies »
- Mark as New
- Bookmark
- Subscribe
- Mute
- Subscribe to RSS Feed
- Permalink
- Report Inappropriate Content
- Mark as New
- Bookmark
- Subscribe
- Mute
- Subscribe to RSS Feed
- Permalink
- Report Inappropriate Content
The expression would depend on your date field data format. Try to share a qvw with sample data.
- Mark as New
- Bookmark
- Subscribe
- Mute
- Subscribe to RSS Feed
- Permalink
- Report Inappropriate Content
Hi,
The following is my Excel Data.
| Year | Month | Machine |
| 2015 | 10 | A |
| 2015 | 10 | B |
| 2015 | 10 | B |
| 2015 | 10 | B |
| 2015 | 11 | A |
| 2015 | 11 | A |
| 2015 | 12 | C |
| 2015 | 12 | C |
| 2015 | 12 | B |
| 2015 | 12 | B |
| 2016 | 1 | A |
| 2016 | 1 | A |
| 2016 | 1 | C |
| 2016 | 2 | B |
| 2016 | 2 | B |
| 2016 | 2 | B |
| 2016 | 2 | A |
I need to calculate the Count(all Machine) per past three Month.
The rolling result shoud be : If I select "Year=2016, Month=1,"
Count[(Year =2016 ,Month=1 )+ (Year = 2015 ,Month=12) + (Year=2015 ,Month=11) Machine]
If I use the following exprssion, the value could be Zero. (I need to calculate the Value to cross the Year.)
rangecount(above(count(Machine), RowNo(Total)))
- Mark as New
- Bookmark
- Subscribe
- Mute
- Subscribe to RSS Feed
- Permalink
- Report Inappropriate Content
- Mark as New
- Bookmark
- Subscribe
- Mute
- Subscribe to RSS Feed
- Permalink
- Report Inappropriate Content
Hi,
Check this as expression,
Sum({<Year=, Month =, Date={"$(='>=' & MonthStart(Today(), -2) & '<=' & MonthEnd(Today()))"}>} Sales)
HTH,
Hirish
“Aspire to Inspire before we Expire!”
- Mark as New
- Bookmark
- Subscribe
- Mute
- Subscribe to RSS Feed
- Permalink
- Report Inappropriate Content
Try this expression
sum({<Date={$(=Max(Date))}>}SalesAmount)
+sum({<Date={$(=Max(Date)-1)}>}SalesAmount)
+sum({<Date={$(=Max(Date)-2)}>}SalesAmount)
- Mark as New
- Bookmark
- Subscribe
- Mute
- Subscribe to RSS Feed
- Permalink
- Report Inappropriate Content
- Mark as New
- Bookmark
- Subscribe
- Mute
- Subscribe to RSS Feed
- Permalink
- Report Inappropriate Content
Hi. I prefer in similar situations to use precalculated in script values. But only when amount of months is constant.
In this situation i suggest to use additional table without association. We obtain tables after perfoming of script:
******************
Table1:
LOAD
MonthName(MonthEnd(MakeDate(ПериодГод,ПериодМесяц))) as YearAndMonth,
Продажи as Sales;
LOAD
Left(Период,4) as ПериодГод,
Mid(Период,Index(Период,'/') + 1) as ПериодМесяц,
Продажи
FROM
(ooxml, embedded labels, table is Лист1);
Table2:
LOAD
YearAndMonth as YearAndMonthForVisualisation
Resident
Table1;
********************
Table1:
| YearAndMonth | Sales |
| jan 2016 | 100 |
| dec 2015 | 200 |
| aug 2015 | 260 |
| nov 2015 | 300 |
| sep 2015 | 350 |
| oct 2015 | 400 |
| jul 2015 | 500 |
Table2:
| YearAndMonthForVisualisation |
| jan 2016 |
| dec 2015 |
| nov 2015 |
| oct 2015 |
| sep 2015 |
| aug 2015 |
| jul 2015 |
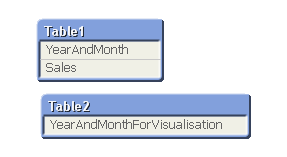
Values in YearAndMonth and in YearAndMonthForVisualisation are numeric in their nature. They are obtained by function 'MonthName'. After that we create visualisation: ListBox and Straight table. Dimension in straight table is 'YearAndMonthForVisualisation'.
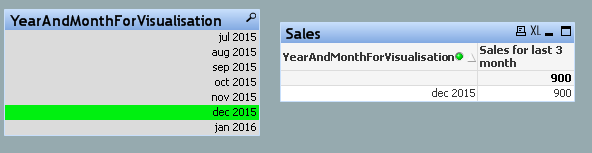
We use expression:Sum ({<YearAndMonth={'>=$(#=MonthStart(AddMonths(Max(YearAndMonthForVisualisation),-2)))<=$(#=Max(YearAndMonthForVisualisation))'}>}Sales).
I hope it is helpful.
- Mark as New
- Bookmark
- Subscribe
- Mute
- Subscribe to RSS Feed
- Permalink
- Report Inappropriate Content
Try this
Sum({<FieldDate={">=$(MonthStart(Addmonths(Min(Today()),-3)))<=$(MonthEnd(Addmonths(Max(Today()),3)))"}>}Sales)
or
Sum({<FieldDate={">=$(MonthStart(Addmonths(Min(FieldDate),-3)))<=$(MonthEnd(Addmonths(Max(FieldDate),3)))"}>}Sales)
Regards.
- « Previous Replies
-
- 1
- 2
- Next Replies »