Unlock a world of possibilities! Login now and discover the exclusive benefits awaiting you.
- Qlik Community
- :
- All Forums
- :
- QlikView App Dev
- :
- How to Display Negative values in Pie Chart?
- Subscribe to RSS Feed
- Mark Topic as New
- Mark Topic as Read
- Float this Topic for Current User
- Bookmark
- Subscribe
- Mute
- Printer Friendly Page
- Mark as New
- Bookmark
- Subscribe
- Mute
- Subscribe to RSS Feed
- Permalink
- Report Inappropriate Content
How to Display Negative values in Pie Chart?
Hi folks,
In my data it has some negative values, I want to show that negative values as well as positive values in my pie chart.
find the data and sample chart, Please help me on that.
- Tags:
- new_to_qlikview
- Mark as New
- Bookmark
- Subscribe
- Mute
- Subscribe to RSS Feed
- Permalink
- Report Inappropriate Content
If you want to display positive and negative numbers, a pie chart is not the correct / preferred visualization.
Consider using a bar chart instead.
- Mark as New
- Bookmark
- Subscribe
- Mute
- Subscribe to RSS Feed
- Permalink
- Report Inappropriate Content
How do expect a pie chart to reflect the negative numbers if there also positive numbers? Onno is correct - a pie chart cannot be used for such as visualisation, and any attempt to force (by Fabs() ing the results, fo example) it will distort the result significantly.
- Mark as New
- Bookmark
- Subscribe
- Mute
- Subscribe to RSS Feed
- Permalink
- Report Inappropriate Content
use FABS command
If the issue is solved please mark the answer with Accept as Solution & like it.
If you want to go quickly, go alone. If you want to go far, go together.
- Mark as New
- Bookmark
- Subscribe
- Mute
- Subscribe to RSS Feed
- Permalink
- Report Inappropriate Content
Nah, use a better visualization instead  .
.
- Mark as New
- Bookmark
- Subscribe
- Mute
- Subscribe to RSS Feed
- Permalink
- Report Inappropriate Content
DO NOT JUST USE THE FABS COMMAND! This just distorts the data and is still not a useful visualisation
- Mark as New
- Bookmark
- Subscribe
- Mute
- Subscribe to RSS Feed
- Permalink
- Report Inappropriate Content
I think instead of bar chart you can use water fall chart !! for better visualization
Vikas
If the issue is solved please mark the answer with Accept as Solution & like it.
If you want to go quickly, go alone. If you want to go far, go together.
- Mark as New
- Bookmark
- Subscribe
- Mute
- Subscribe to RSS Feed
- Permalink
- Report Inappropriate Content
I tried with FABS it converts the values -ve to +ve and it displays, But my requirement is it shows both -ve as well as +ve values.
- Mark as New
- Bookmark
- Subscribe
- Mute
- Subscribe to RSS Feed
- Permalink
- Report Inappropriate Content
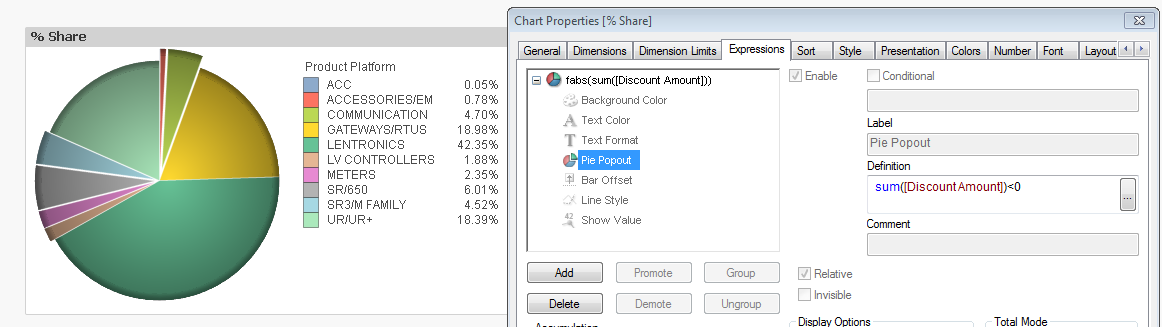
I do not want to put it as a suggestion because I do not think PIE chart should be used when you have negative values.
But one possibility is to some how indicate which slices are negative. That you can achieve it by using PIE pop out to show those which are negative.
As Vikas mentioned without using fabs in your expression you can not build the PIE chart. Once you use the fabs in your chart expression then you go to Pie Pop out option to put a condition to show the negative ones as pop out slices.
not sure how end users will take it. but my suggestion to use a st. table with color format to indicate the negative ones than positive values.