Unlock a world of possibilities! Login now and discover the exclusive benefits awaiting you.
- Qlik Community
- :
- All Forums
- :
- QlikView App Dev
- :
- How to add an avg distinct function with set analy...
- Subscribe to RSS Feed
- Mark Topic as New
- Mark Topic as Read
- Float this Topic for Current User
- Bookmark
- Subscribe
- Mute
- Printer Friendly Page
- Mark as New
- Bookmark
- Subscribe
- Mute
- Subscribe to RSS Feed
- Permalink
- Report Inappropriate Content
How to add an avg distinct function with set analysis
Dear All,
Could someone please help me with below issue I am facing. need 4 expressions, but I am not able to succeed with the last one.
I added an attachment with the values and formula's I used.
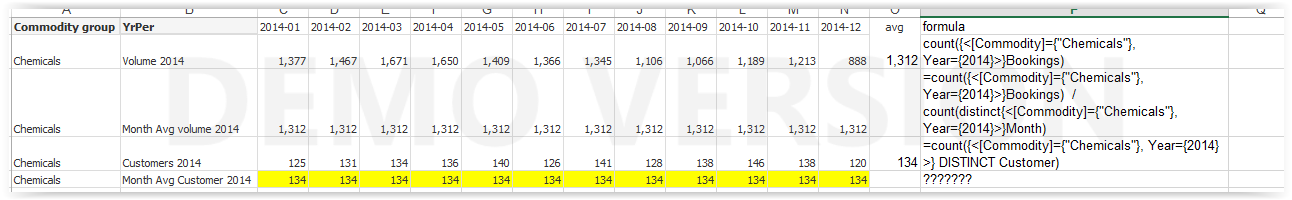
I do a distinct count on Customer, so it gives me all unique customers per month.
In the 4th expression I want to show the average of these 12 months, so the total average of expression 3.
the average over 2014 for all unique customers is 134 (see example). I want to show this as a separate value in my 4th expression, so I can calculate deviations, etc. does anyone have an idea on how to do this?
Thanks for your help
- Mark as New
- Bookmark
- Subscribe
- Mute
- Subscribe to RSS Feed
- Permalink
- Report Inappropriate Content
include a total to you last set analysis
=count(total {<[Commodity]={"Chemicals"}, Year={2014} >} DISTINCT Customer)
- Mark as New
- Bookmark
- Subscribe
- Mute
- Subscribe to RSS Feed
- Permalink
- Report Inappropriate Content
HI Ramon,
Thanks for replying. But this formula gives me the total unique customers for 2014. and gives me value 347.
I am looking for the total average unique customers per month (even when a customer is booking each month). just like my example. the value should be 134 (average of the months 2014 as shown in expression 3).
Regards,
Bob
- Mark as New
- Bookmark
- Subscribe
- Mute
- Subscribe to RSS Feed
- Permalink
- Report Inappropriate Content
No offence intended, but wouldn't the average per month be a bit strange to show in a month column?
I would make a separate chart (Pivot or Straight) to show the years and commodities in and that chart have a column to show the average per year.
The expression for a chart like that would be like this:
= avg(aggr(count(distinct Customer), Month, Commodity))