Unlock a world of possibilities! Login now and discover the exclusive benefits awaiting you.
- Qlik Community
- :
- All Forums
- :
- QlikView App Dev
- :
- Re: How to add an specific filter on a line chart?
- Subscribe to RSS Feed
- Mark Topic as New
- Mark Topic as Read
- Float this Topic for Current User
- Bookmark
- Subscribe
- Mute
- Printer Friendly Page
- Mark as New
- Bookmark
- Subscribe
- Mute
- Subscribe to RSS Feed
- Permalink
- Report Inappropriate Content
How to add an specific filter on a line chart?
Hi,
I am creating a Line Chart on QlikView, I am using a field that will have the date as the following: 2016-09, 2016-08, ..., 2014-01
The problem is that I will like to display on the chart only the last 6 months, for this I am trying to add a calculated dimension for this field, but it's not working.
When I used just the field, all months are being displayed from the last 2 years, I tried to add an additional filter as =YearMonth >'2016-02', but is not working, if I removed the field and leave only this calculated dimension the line chart only displays one value.
What can I do to fix this?
- « Previous Replies
-
- 1
- 2
- Next Replies »
- Mark as New
- Bookmark
- Subscribe
- Mute
- Subscribe to RSS Feed
- Permalink
- Report Inappropriate Content
I have also tried something like this = count({<[YRMON]<{'2016-03'}>} [AutoID]) in the expressions, but the dashboard got a big X it's not showing the data that I need.
- Mark as New
- Bookmark
- Subscribe
- Mute
- Subscribe to RSS Feed
- Permalink
- Report Inappropriate Content
Hi,
If you can attach some sample file then it would be easier to understand and give the solution.
Regards,
Jagan.
- Mark as New
- Bookmark
- Subscribe
- Mute
- Subscribe to RSS Feed
- Permalink
- Report Inappropriate Content
I cannot attached an example, but I will try to be clear on my explanation. I have 3 fields ID, YRMON and Region, ID is the unique identification number, YRMON is the year and month when the ID was open and the region will be ASIA, AMERICA or EUROPE. Then I added a line chart
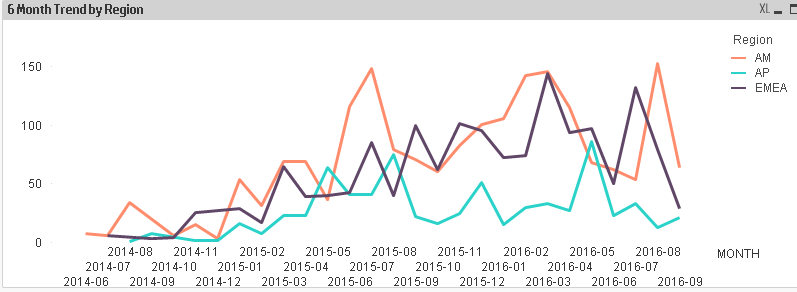
This char will display all the YRMON, the 3 regions and the quantity of records per month. Using as dimensions YRMON and Region, and as expression the count of IDs.
What I would like to have is that the chart only displays the last 6 YRMON. I have tried adding the above conditions as dimensions or = count({<[YRMON]<{'2016-03'}>} [AutoID]) as expression. But didn't work.
Any idea on how to do this?
- Mark as New
- Bookmark
- Subscribe
- Mute
- Subscribe to RSS Feed
- Permalink
- Report Inappropriate Content
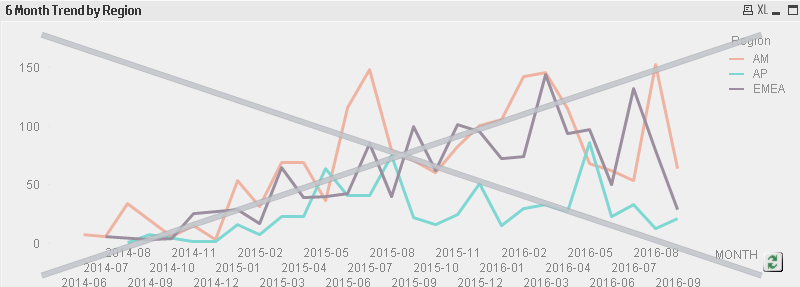
From this graph what area you expecting
Try this
count({<[YRMON] = {'<' & '2016-03'}>}[AutoID])
- Mark as New
- Bookmark
- Subscribe
- Mute
- Subscribe to RSS Feed
- Permalink
- Report Inappropriate Content
Didn't work. I got a big X on the chart:
- Mark as New
- Bookmark
- Subscribe
- Mute
- Subscribe to RSS Feed
- Permalink
- Report Inappropriate Content
This is what I did to fix this problem.
First added 2 fields in the script:
LOAD *, Mid(YRMON,1,4) as YR_Cal,Mid(YRMON,6,2) as Month;
Then I used them in the expression filter as the following:
=Count({1<YR_Cal={2016}, Month={">03"} >} AutoID)
The filter is working correctly.  thank you all for your effort.
- Mark as New
- Bookmark
- Subscribe
- Mute
- Subscribe to RSS Feed
- Permalink
- Report Inappropriate Content
Good. close this link by giving Correct and Helpful answers to the posts which helps you.
Regards,
Jagan.
- « Previous Replies
-
- 1
- 2
- Next Replies »