Unlock a world of possibilities! Login now and discover the exclusive benefits awaiting you.
- Qlik Community
- :
- All Forums
- :
- QlikView App Dev
- :
- How to add general totals on average expressions i...
- Subscribe to RSS Feed
- Mark Topic as New
- Mark Topic as Read
- Float this Topic for Current User
- Bookmark
- Subscribe
- Mute
- Printer Friendly Page
- Mark as New
- Bookmark
- Subscribe
- Mute
- Subscribe to RSS Feed
- Permalink
- Report Inappropriate Content
How to add general totals on average expressions in a pivot table?
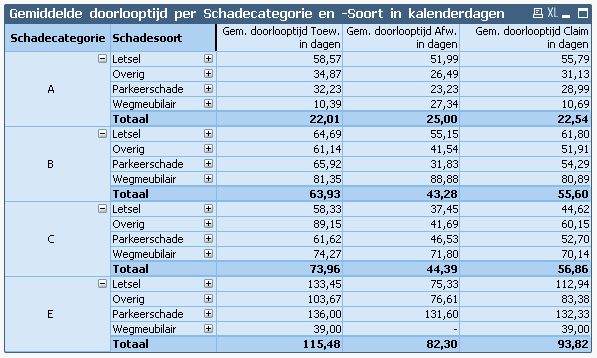
I have this pivot table, which shows average values. I derived these values from a database table, by substracting creation date from decision date (in a damage claim), which renders throughput time in a damage claim (time from creation to decision).
In my database table, I created three extra extra values: Throughput time for negative and positive decisions and one for 'total' throughput time (which of course equals one of the former two, per record in my database).
In my pivot table, I want to show AVERAGE throughput time per claim category and type. I used avg() functions as three expressions.
Somehow, I can't totalise throughput time for ALL categories and types....
I am sure the solution should be simple, but ticking the boxes for subtotals for my dimensions did NOT do it...
Here's the table:

Accepted Solutions
- Mark as New
- Bookmark
- Subscribe
- Mute
- Subscribe to RSS Feed
- Permalink
- Report Inappropriate Content
I guess I have finally found the answer....
When using an 'If' clause in an expression, QV won't totalize that expression in a (pivot) table. Once I got rid of that clause, it summed my table flawlessly...
- Mark as New
- Bookmark
- Subscribe
- Mute
- Subscribe to RSS Feed
- Permalink
- Report Inappropriate Content
I hope this would be helpful for you: Average – Which average?
- Marcus
- Mark as New
- Bookmark
- Subscribe
- Mute
- Subscribe to RSS Feed
- Permalink
- Report Inappropriate Content
Thanks, Marcus! But.. it's not about calculating average throughput times, although the suggestions on that page sure are helpful, but about getting those averages summed up and displayed as a general total (weighed) average..
- Mark as New
- Bookmark
- Subscribe
- Mute
- Subscribe to RSS Feed
- Permalink
- Report Inappropriate Content
I'm not quite sure what you want to be calculated and how the result should looks like but mosten often you need to calculate rather sum(y) / count(y) instead of avg(y) and/or you need an aggr-functions which wrapped one of those calculations like: avg(aggr(sum(y) / count(y), Dimensions)) or sum(aggr(avg(y), Dimensions)) and you could also use different calculations for the different chart-levels if you queried them per if(dimensionality() < 1, exp1, exp2).
- Marcus
- Mark as New
- Bookmark
- Subscribe
- Mute
- Subscribe to RSS Feed
- Permalink
- Report Inappropriate Content
Hi,
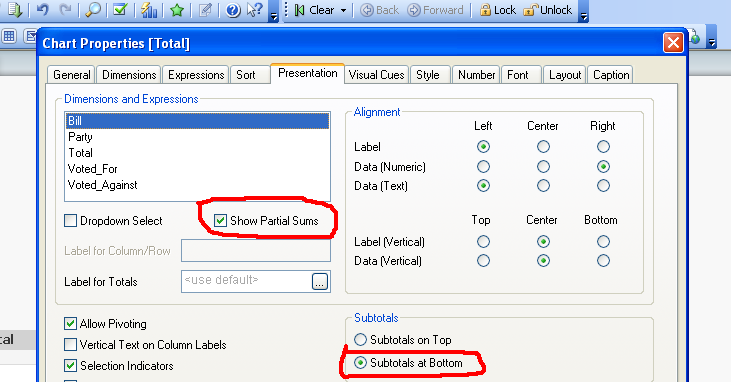
Go For Presentation tab,as do as shown int the below image,for which dimension you want the total select that and click on show partial sum as shown int the below figure.

- Mark as New
- Bookmark
- Subscribe
- Mute
- Subscribe to RSS Feed
- Permalink
- Report Inappropriate Content
Hi Harshitha,
I wished it was that simple... Those boxes are already ticked.... ![]()
- Mark as New
- Bookmark
- Subscribe
- Mute
- Subscribe to RSS Feed
- Permalink
- Report Inappropriate Content
I would like - below the box 'E' to be a box named 'Total', which shows average totals per row for the damage types and a grand total.
- Mark as New
- Bookmark
- Subscribe
- Mute
- Subscribe to RSS Feed
- Permalink
- Report Inappropriate Content
Like above mentioned you could enable the partial sums for Schadecategorie and use a aggr() or an dimensionality-condition to calculate your wanted values. If they are very special it could be that you need to create within the script an additionally dummy-value Totaal for Schadecategorie and then react with an if-loop in your calculation if it's a real value for the expression or your dummy whereby the calculation then might be extend with some set analysis statement and/or total qualifier.
- Marcus
- Mark as New
- Bookmark
- Subscribe
- Mute
- Subscribe to RSS Feed
- Permalink
- Report Inappropriate Content
I guess I have finally found the answer....
When using an 'If' clause in an expression, QV won't totalize that expression in a (pivot) table. Once I got rid of that clause, it summed my table flawlessly...