Unlock a world of possibilities! Login now and discover the exclusive benefits awaiting you.
- Qlik Community
- :
- All Forums
- :
- QlikView App Dev
- :
- Re: How to change the chart display through button...
- Subscribe to RSS Feed
- Mark Topic as New
- Mark Topic as Read
- Float this Topic for Current User
- Bookmark
- Subscribe
- Mute
- Printer Friendly Page
- Mark as New
- Bookmark
- Subscribe
- Mute
- Subscribe to RSS Feed
- Permalink
- Report Inappropriate Content
How to change the chart display through button object for 3,6,9 months?
Hello Everyone,
I am new to QlikView and require kind support in solving the below requirement.
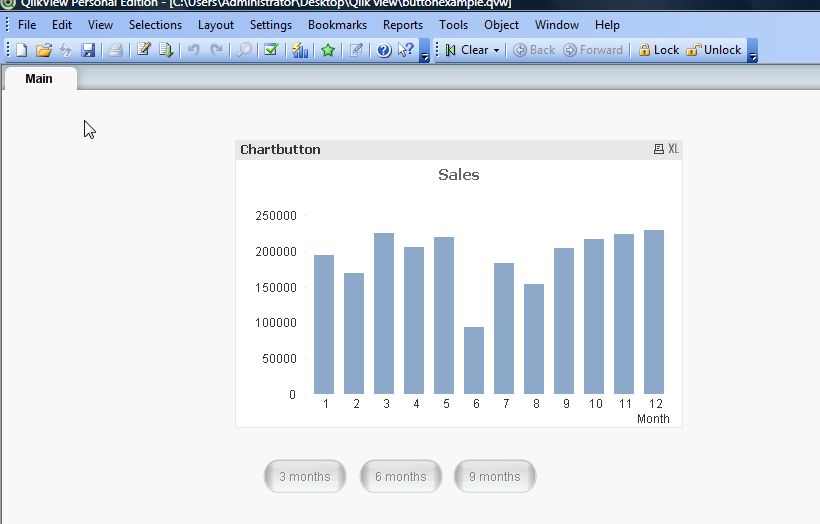
I created a chart object with Month as dimension on X-axis and Sum(Sales) on Y-axis. I need to place three buttons in the document which would change the chart on button click.
On first button click it should display only first 3 months data in chart, similarly second should display 6 months and last button should display 9 months data. Please see the below image.
Please let me know how this can be achieved.
Best Regards,
Vivek
- Tags:
- new_to_qlikview
Accepted Solutions
- Mark as New
- Bookmark
- Subscribe
- Mute
- Subscribe to RSS Feed
- Permalink
- Report Inappropriate Content
Hi,
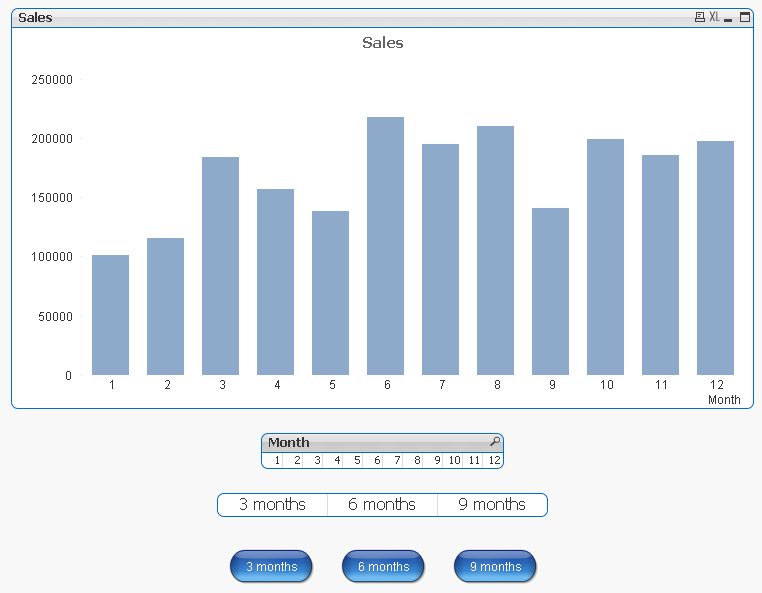
possible solutions could be:
1. (horizontal) listbox using the Month field
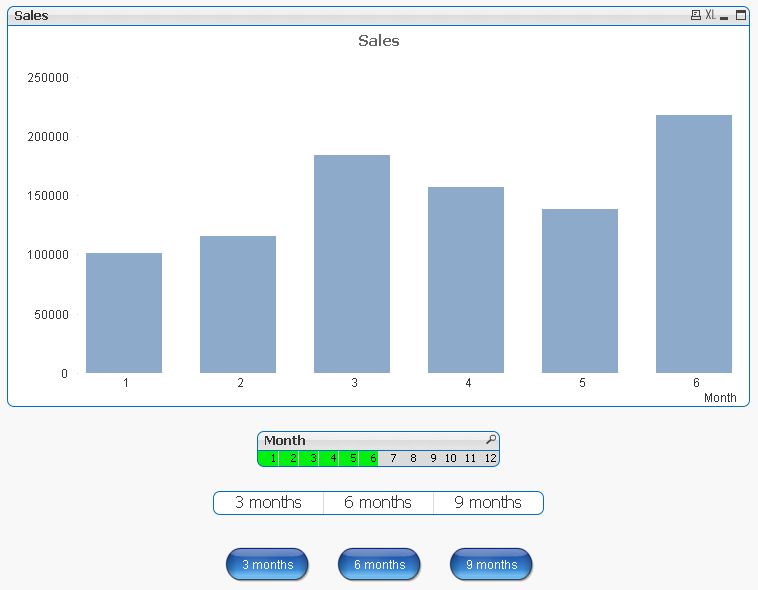
2. (horizontal) listbox using a Month selector field inline loaded in the script
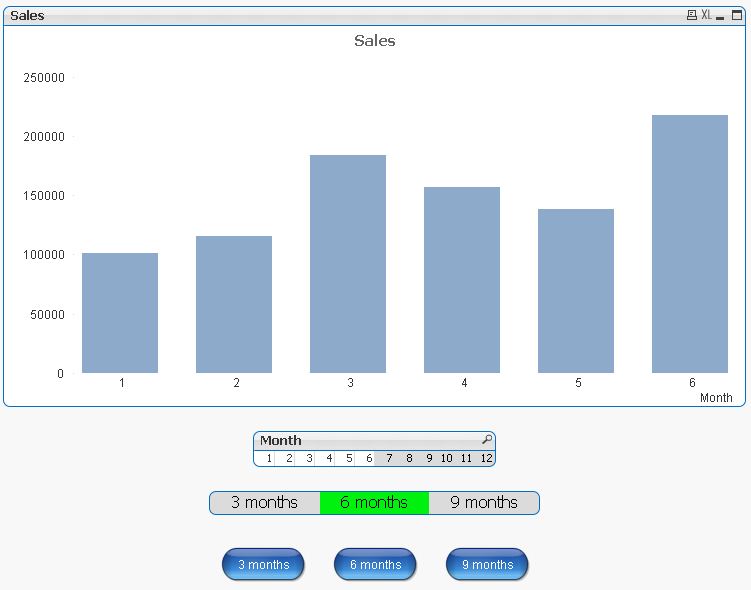
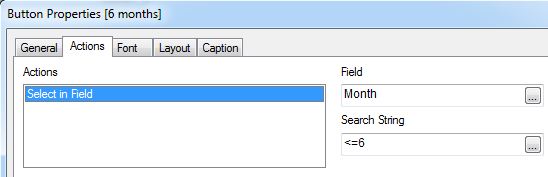
3. buttons using selection actions
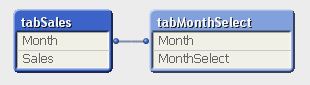
tabSales:
LOAD RecNo() as Month,
    Money(100000+Ceil(Rand()*150000)) as Sales
AutoGenerate 12;

tabMonthSelect:
LOAD * INLINE [
    Month, MonthSelect
    1, 3 months
    2, 3 months
    3, 3 months
    1, 6 months
    2, 6 months
    3, 6 months
    4, 6 months
    5, 6 months
    6, 6 months
    1, 9 months
    2, 9 months
    3, 9 months
    4, 9 months
    5, 9 months
    6, 9 months
    7, 9 months
    8, 9 months
    9, 9 months
];
hope this helps
regards
Marco
- Mark as New
- Bookmark
- Subscribe
- Mute
- Subscribe to RSS Feed
- Permalink
- Report Inappropriate Content
Which month? I believe you don't need buttons you and/or your user could simple use listboxex to select the wished periods - maybe extended by a field "quarter".
- Marcus
- Mark as New
- Bookmark
- Subscribe
- Mute
- Subscribe to RSS Feed
- Permalink
- Report Inappropriate Content
or select the bar (3, 6, 9, months) in the chart
- Mark as New
- Bookmark
- Subscribe
- Mute
- Subscribe to RSS Feed
- Permalink
- Report Inappropriate Content
Hi,
possible solutions could be:
1. (horizontal) listbox using the Month field
2. (horizontal) listbox using a Month selector field inline loaded in the script
3. buttons using selection actions
tabSales:
LOAD RecNo() as Month,
    Money(100000+Ceil(Rand()*150000)) as Sales
AutoGenerate 12;

tabMonthSelect:
LOAD * INLINE [
    Month, MonthSelect
    1, 3 months
    2, 3 months
    3, 3 months
    1, 6 months
    2, 6 months
    3, 6 months
    4, 6 months
    5, 6 months
    6, 6 months
    1, 9 months
    2, 9 months
    3, 9 months
    4, 9 months
    5, 9 months
    6, 9 months
    7, 9 months
    8, 9 months
    9, 9 months
];
hope this helps
regards
Marco
- Mark as New
- Bookmark
- Subscribe
- Mute
- Subscribe to RSS Feed
- Permalink
- Report Inappropriate Content
Hi Vivek,
please look at attached app.
I used:
a vriable (v_period)
the property "Restrict wich values are displayed..." setting show only "First" and using v_period as Values
I have few dates so I set my buttons to show 1, 2 or 3 months, but you can change action settings for each button
Let me know if it's what you are looking for.
Best regards
Andrea
- Mark as New
- Bookmark
- Subscribe
- Mute
- Subscribe to RSS Feed
- Permalink
- Report Inappropriate Content
Thank you so much sir for giving 3 different solutions. I practiced all three methods and got the result.
- Mark as New
- Bookmark
- Subscribe
- Mute
- Subscribe to RSS Feed
- Permalink
- Report Inappropriate Content
Glad I could help.
please close your thread if your question is answered.
thanks
regards
Marco
- Mark as New
- Bookmark
- Subscribe
- Mute
- Subscribe to RSS Feed
- Permalink
- Report Inappropriate Content
Thanks for your reply. I will try your suggested method as well.