Unlock a world of possibilities! Login now and discover the exclusive benefits awaiting you.
- Qlik Community
- :
- All Forums
- :
- QlikView App Dev
- :
- How to color code non aggregated tabular data base...
- Subscribe to RSS Feed
- Mark Topic as New
- Mark Topic as Read
- Float this Topic for Current User
- Bookmark
- Subscribe
- Mute
- Printer Friendly Page
- Mark as New
- Bookmark
- Subscribe
- Mute
- Subscribe to RSS Feed
- Permalink
- Report Inappropriate Content
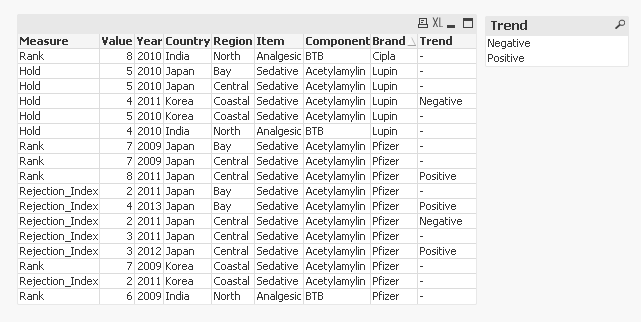
How to color code non aggregated tabular data based on increase of measure value ?
Hi All ,
How to color code non aggregated tabular data based on increase of measure value ?
Table
| Measure | Value | Year | Country | Region | Item | Component | Brand |
| Rank | 8 | 2010 | India | North | Analgesic | BTB | Cipla |
| Rank | 8 | 2011 | Japan | Central | Sedative | Acetylamylin | Pfizer |
| Rank | 7 | 2009 | Japan | Central | Sedative | Acetylamylin | Pfizer |
| Rank | 7 | 2009 | Korea | Coastal | Sedative | Acetylamylin | Pfizer |
| Rank | 7 | 2009 | Japan | Bay | Sedative | Acetylamylin | Pfizer |
| Rank | 6 | 2009 | India | North | Analgesic | BTB | Pfizer |
| Hold | 5 | 2010 | Japan | Central | Sedative | Acetylamylin | Lupin |
| Hold | 5 | 2010 | Korea | Coastal | Sedative | Acetylamylin | Lupin |
| Hold | 5 | 2010 | Japan | Bay | Sedative | Acetylamylin | Lupin |
| Hold | 4 | 2010 | India | North | Analgesic | BTB | Lupin |
| Hold | 4 | 2011 | Korea | Coastal | Sedative | Acetylamylin | Lupin |
| Rejection_Index | 4 | 2013 | Japan | Bay | Sedative | Acetylamylin | Pfizer |
| Rejection_Index | 3 | 2011 | Japan | Central | Sedative | Acetylamylin | Pfizer |
| Rejection_Index | 3 | 2012 | Japan | Central | Sedative | Acetylamylin | Pfizer |
| Rejection_Index | 2 | 2011 | Japan | Central | Sedative | Acetylamylin | Pfizer |
| Rejection_Index | 2 | 2011 | Korea | Coastal | Sedative | Acetylamylin | Pfizer |
| Rejection_Index | 2 | 2011 | Japan | Bay | Sedative | Acetylamylin | Pfizer |
OutPut
- « Previous Replies
-
- 1
- 2
- Next Replies »
Accepted Solutions
- Mark as New
- Bookmark
- Subscribe
- Mute
- Subscribe to RSS Feed
- Permalink
- Report Inappropriate Content
May be this
Legend:
LOAD AutoNumber(Measure&Country&Region&Item&Component&Brand) as Key,
Measure,
Value,
Year,
Country,
Region,
Item,
Component,
Brand
FROM
[Colour on Aggr Data.xlsx]
(ooxml, embedded labels, table is Table);
FinalTable:
LOAD *,
If(Key = Previous(Key), If(Value > Previous(Value), 'Positive', If(Value < Previous(Value), 'Negative'))) as Trend
Resident Legend
Order By Key, Year;
DROP Table Legend;
- Mark as New
- Bookmark
- Subscribe
- Mute
- Subscribe to RSS Feed
- Permalink
- Report Inappropriate Content
I have attached sample data with expected output and logic
- Mark as New
- Bookmark
- Subscribe
- Mute
- Subscribe to RSS Feed
- Permalink
- Report Inappropriate Content

- Mark as New
- Bookmark
- Subscribe
- Mute
- Subscribe to RSS Feed
- Permalink
- Report Inappropriate Content
stalwar1 ... Anything wrong Sir , with my data
- Mark as New
- Bookmark
- Subscribe
- Mute
- Subscribe to RSS Feed
- Permalink
- Report Inappropriate Content
Sir?? ... Whatever happened to Sunny Bhai 
Nothing wrong with your data... I just didn't open the Excel file until you mentioned that in your post
I have attached sample data with expected output and logic
- Mark as New
- Bookmark
- Subscribe
- Mute
- Subscribe to RSS Feed
- Permalink
- Report Inappropriate Content
Accha .. i got it . I thought that by mistake i have uploaded wrong data , possibly a blank sheet .
Again ... needed your help Sunny Bhai .
Actually i had to show data with
1) Colour coding in Table (which is already there in excel)
2) List Box based selection : If user select field value as Positive then aap show show only product those whose mesaure values are increasing and if selection is Negative then it should show measure values of product which got decreased over period of time .
Thanks & Regards
Shekar
- Mark as New
- Bookmark
- Subscribe
- Mute
- Subscribe to RSS Feed
- Permalink
- Report Inappropriate Content
May be this
Legend:
LOAD AutoNumber(Measure&Country&Region&Item&Component&Brand) as Key,
Measure,
Value,
Year,
Country,
Region,
Item,
Component,
Brand
FROM
[Colour on Aggr Data.xlsx]
(ooxml, embedded labels, table is Table);
FinalTable:
LOAD *,
If(Key = Previous(Key), If(Value > Previous(Value), 'Positive', If(Value < Previous(Value), 'Negative'))) as Trend
Resident Legend
Order By Key, Year;
DROP Table Legend;
- Mark as New
- Bookmark
- Subscribe
- Mute
- Subscribe to RSS Feed
- Permalink
- Report Inappropriate Content
Thank You Bhai ...
I have just one question , that cant there be an alternative to above solution .
My only concern is that the Key you have created is from multiple field , and what if real time data is huge and full of unique values . Wont this key creation degrade the performance ?
I am sure this question might be very silly for a Legend  .
.
- Mark as New
- Bookmark
- Subscribe
- Mute
- Subscribe to RSS Feed
- Permalink
- Report Inappropriate Content
I have not done a lot of testing around AutoNumber, but I have found it to be slightly slower with large amount of data.... other alternative is this....
Legend:
LOAD Measure,
Value,
Year,
Country,
Region,
Item,
Component,
Brand
FROM
[Colour on Aggr Data.xlsx]
(ooxml, embedded labels, table is Table);
FinalTable:
LOAD *,
If(Measure = Previous(Measure) and Country = Previous(Country) and Region = Previous(Region) and
Item = Previous(Item) and Component = Previous(Component) and Brand = Previous(Brand),
If(Value > Previous(Value), 'Positive',
If(Value < Previous(Value), 'Negative'))) as Trend
Resident Legend
Order By Measure, Country, Region, Item, Component, Brand, Year;
DROP Table Legend;
But any which way you would have to Order By all your fields which form your key and use them in the If statement....
- Mark as New
- Bookmark
- Subscribe
- Mute
- Subscribe to RSS Feed
- Permalink
- Report Inappropriate Content
Sunny Bhai , I observed that for one Scenario , Trend Setting is not working .
If you see Rejection Index is coming negative for one scenario for year 2011 , but instead of that value negative should have populated for year 2012 ...
Actually year 2011 have two entry , in such scenarios that record with max value of given measure should be used for comparison .
I have saved that in qvw for easy reference .
Note : I have made slight change it data .
Thanks & Regards
Shekar
- « Previous Replies
-
- 1
- 2
- Next Replies »