Unlock a world of possibilities! Login now and discover the exclusive benefits awaiting you.
- Qlik Community
- :
- All Forums
- :
- QlikView App Dev
- :
- How to compare 2 tables and put non-matching resul...
- Subscribe to RSS Feed
- Mark Topic as New
- Mark Topic as Read
- Float this Topic for Current User
- Bookmark
- Subscribe
- Mute
- Printer Friendly Page
- Mark as New
- Bookmark
- Subscribe
- Mute
- Subscribe to RSS Feed
- Permalink
- Report Inappropriate Content
How to compare 2 tables and put non-matching results?
Hello,
I am really new to the community and really new to 'coding' I have basic comcept of programing (pascal) and that's about it.
I find QlikView very intuitive and brilliant and want to learn more about it.
I would like to compare the 2 tables in excel spreadsheet but pull the records that does not match each according to primary key.
| Header 1 | Header 2 | Header 3 | Header 4 | Header 5 | Header 6 | Header 7 |
|---|---|---|---|---|---|---|
| table 1 | table 2 | |||||
| Number | String | Extra 1 | Number | String | Extra 2 | |
| 1 | A | 12 | 2 | K | 6 | |
| 3 | B | 3 | 3 | B | 3 | |
| 4 | C | 55 | 7 | E | 76 | |
| 5 | D | 323 | ||||
| 7 | E | 76 |
in above table, I want to compare the table 1 and 2 by column 'Number' and pull the rows that does not match.
Can please someone help me?
Thank you!
- « Previous Replies
-
- 1
- 2
- Next Replies »
Accepted Solutions
- Mark as New
- Bookmark
- Subscribe
- Mute
- Subscribe to RSS Feed
- Permalink
- Report Inappropriate Content
OK, here's an example script doing similar to what you're looking for:
Table:
LOAD *
,'Table 1' as Table
INLINE [
OrderItem, Customer, Amount
OI1, Ann, 500
OI2, Bob, 600
OI3, Charlie, 2000
OI4, Dennis, 200
OI6, Fred, 500
];
CONCATENATE
LOAD *
,'Table 2' as Table
INLINE [
OrderItem, Customer, Amount
OI2, Bobby, 600
OI3, Charlie, 200
OI4, Dennis, 200
OI5, Erin, 500
OI6, Fred, 500
];
INNER JOIN (Table)
LOAD *
WHERE "Only in One Table?"
OR "Customer Different?"
OR "Amount Different?"
;
LOAD
OrderItem
,if(count(OrderItem)<2,-1) as "Only in One Table?"
,if(maxstring(Customer)<>minstring(Customer),-1) as "Customer Different?"
,if(max(Amount)<>min(Amount),-1) as "Amount Different?"
RESIDENT Table
GROUP BY OrderItem
;
Both source tables are concatenated into the same final table, just with a "Table" field identifying the source. Then we load another table keyed and grouped by order item, the key we want to compare rows for. Since we're grouping, we can compare the values from both tables with aggregation expressions like min() and max(). Finally we inner join this new table back to the first, though with a preceding load to save time and space. The inner join eliminates any rows that don't have any differences. You could keep them if you wanted and set an overall "Row Different?" flag using the current WHERE logic for this inner join.
Now in the application, we can calculate some things:
Number of Records with Differences = count(distinct OrderItem)
Records in Only One Table = count("Only in One Table?")
Customer Differences = count("Customer Different?")/2
Amount Differences = count("Amount Different?")/2
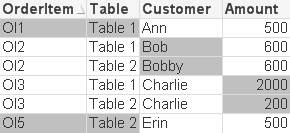
We can also make a chart that highlights the differences. Make a straight table with OrderItem, Table, Customer and Amount as dimensions. No expressions, and remove the checkmark that suppresses zero values. Now set a background color expression for every dimension:
OrderItem = if("Only in One Table?",lightgray())
Table = if("Only in One Table?",lightgray())
Customer = if("Customer Different?",lightgray())
Amount = if("Amount Different?",lightgray())
Edit: The chart looks like this. If the record is only in one table, the key and the table are highlighted. If in both tables, all field differences are highlighted.
- Mark as New
- Bookmark
- Subscribe
- Mute
- Subscribe to RSS Feed
- Permalink
- Report Inappropriate Content
Hi!
Plz find the attachment.
Hope u find ur Solution.
- Mark as New
- Bookmark
- Subscribe
- Mute
- Subscribe to RSS Feed
- Permalink
- Report Inappropriate Content
Erika,
Thank you very much for posting the possible answer for me but unfortunately, I am running personal edition of QlikView and I cannot open your attached file. If it is not too much, will you be able to put it on txt file with brief explanation?
Thank you for your help in advance.
- Mark as New
- Bookmark
- Subscribe
- Mute
- Subscribe to RSS Feed
- Permalink
- Report Inappropriate Content
OK, here's an example script doing similar to what you're looking for:
Table:
LOAD *
,'Table 1' as Table
INLINE [
OrderItem, Customer, Amount
OI1, Ann, 500
OI2, Bob, 600
OI3, Charlie, 2000
OI4, Dennis, 200
OI6, Fred, 500
];
CONCATENATE
LOAD *
,'Table 2' as Table
INLINE [
OrderItem, Customer, Amount
OI2, Bobby, 600
OI3, Charlie, 200
OI4, Dennis, 200
OI5, Erin, 500
OI6, Fred, 500
];
INNER JOIN (Table)
LOAD *
WHERE "Only in One Table?"
OR "Customer Different?"
OR "Amount Different?"
;
LOAD
OrderItem
,if(count(OrderItem)<2,-1) as "Only in One Table?"
,if(maxstring(Customer)<>minstring(Customer),-1) as "Customer Different?"
,if(max(Amount)<>min(Amount),-1) as "Amount Different?"
RESIDENT Table
GROUP BY OrderItem
;
Both source tables are concatenated into the same final table, just with a "Table" field identifying the source. Then we load another table keyed and grouped by order item, the key we want to compare rows for. Since we're grouping, we can compare the values from both tables with aggregation expressions like min() and max(). Finally we inner join this new table back to the first, though with a preceding load to save time and space. The inner join eliminates any rows that don't have any differences. You could keep them if you wanted and set an overall "Row Different?" flag using the current WHERE logic for this inner join.
Now in the application, we can calculate some things:
Number of Records with Differences = count(distinct OrderItem)
Records in Only One Table = count("Only in One Table?")
Customer Differences = count("Customer Different?")/2
Amount Differences = count("Amount Different?")/2
We can also make a chart that highlights the differences. Make a straight table with OrderItem, Table, Customer and Amount as dimensions. No expressions, and remove the checkmark that suppresses zero values. Now set a background color expression for every dimension:
OrderItem = if("Only in One Table?",lightgray())
Table = if("Only in One Table?",lightgray())
Customer = if("Customer Different?",lightgray())
Amount = if("Amount Different?",lightgray())
Edit: The chart looks like this. If the record is only in one table, the key and the table are highlighted. If in both tables, all field differences are highlighted.
- Mark as New
- Bookmark
- Subscribe
- Mute
- Subscribe to RSS Feed
- Permalink
- Report Inappropriate Content
Try this:
Table1:
Load
Number,
Number as Number1,
string as string1,
Extra1
from Table1.qvd;
Table2:
Load
Number,
Number as Number2,
string as string2,
Extra2
from Table2.qvd;
After loading it,take a Straight Table.
Dimension:Number
Expression:if(Number=Number1 and Number=Number2,'match','Nomatch')
- Mark as New
- Bookmark
- Subscribe
- Mute
- Subscribe to RSS Feed
- Permalink
- Report Inappropriate Content
Rahul,
Thank you for the reply, however your solution were not able to bring the information that were not matching from both tables.
- Mark as New
- Bookmark
- Subscribe
- Mute
- Subscribe to RSS Feed
- Permalink
- Report Inappropriate Content
John,
I am sorry for the very late reply and very thank you for the answer that I was looking for.
- Mark as New
- Bookmark
- Subscribe
- Mute
- Subscribe to RSS Feed
- Permalink
- Report Inappropriate Content
Hi John,
Can you please help me out in below post. Basically I would like to highlight what is new in new hierarchy. It would be really great if you can help me out here.
- Mark as New
- Bookmark
- Subscribe
- Mute
- Subscribe to RSS Feed
- Permalink
- Report Inappropriate Content
Why do I need to use inline function? How are you supposed to know the fields before hand and what if the table is updated in the future. I am tired of googling out to find a proper solution to this. Sorry to be harsh but I feel its so much complex in Qlikview I know the logic in SQL for this but due to the limitations of Qlikview I cannot find a proper solution.
And your solution is difficult to understand since you haven't taken the names of Field same as those to what the Question has. A proper solution to this without using the INLINE would be really helpful. Thanks in advance.
- Mark as New
- Bookmark
- Subscribe
- Mute
- Subscribe to RSS Feed
- Permalink
- Report Inappropriate Content
It seems like you want a much broader solution, not "I want to compare this specific table and these specific fields", but "I want an app where I can just give it two data sources to compare, tell it the key field or fields, and it loads all fields from both data sources, then builds a chart that highlights the differences." It also seems like you think that's the only proper solution, and that I owe it to you to code the app for you.
I understand your frustration, but I'm not your employee, I didn't cause your problem, and being harsh with me is counter-productive. Nobody owes you a solution. Anyone here who might help you is just someone like you that happens to like to help people in their spare time.
That said, this DOES sound like a very interesting challenge, and I think I know how I'd approach it. For the script, there are functions that let you identify the fields in a table. I'm sure there's a way to loop through those fields and build the necessary data structures. For the chart, I'm sure there's a way to write a macro to add all the fields and do the highlighting. But it would quite a bit more complicated than the solution I posted above, even if it vaguely resembled it.
The first thing I'd do is search around the Internet to see if someone else already wrote such an app. You say you're tired of googling, so maybe it doesn't exist, but I'd check robwunderlich.com for the QlikView Cookbook and QlikView Components. I've worked with Rob, and I am unashamed to say that he is a better QlikView expert than I'll ever be. If not there, I'd be looking around the blogs of other experts, and searching through the forum of course.
But I'm guessing there's no such app. I'm guessing it would take me three to five days to code such an app. And I just don't have that kind of time to donate. I have a job. I'm behind in the projects they pay me for. But if someone has time to donate, and these hints are enough to put them on the right path, or they have better ideas, it might be a nice app for the Qlik community to have.
Some things QlikView is good at. Some things require complex solutions that push the boundaries of its capabilities. This seems to be an example of the latter - QlikView was just not designed to compare two tables and tell you the non-matching results. That just isn't its function, not its strength. I'm sorry if you find that frustrating, but you're trying to hammer a nail with a screwdriver - you can do it, but there's probably a better way. Perhaps there's a better tool out there for this need than QlikView.
- « Previous Replies
-
- 1
- 2
- Next Replies »