Unlock a world of possibilities! Login now and discover the exclusive benefits awaiting you.
- Qlik Community
- :
- All Forums
- :
- QlikView App Dev
- :
- How to count open incidents?
- Subscribe to RSS Feed
- Mark Topic as New
- Mark Topic as Read
- Float this Topic for Current User
- Bookmark
- Subscribe
- Mute
- Printer Friendly Page
- Mark as New
- Bookmark
- Subscribe
- Mute
- Subscribe to RSS Feed
- Permalink
- Report Inappropriate Content
How to count open incidents?
Hi All,
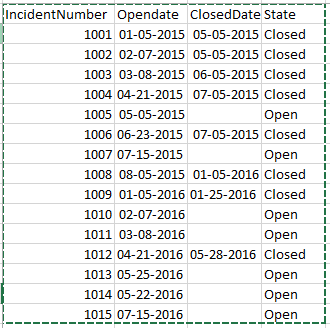
I Need to count the ‘Total Count’ of tickets were open on particular week, not the current state of tickets as 'open'.
For example if ticket was opened on 1st August 2016 and closed on 16th august 2016.
1st July 2016 and closed on 25th July 2016.
The chart should display
Biweeklydate CountOfIncidents
07-04-2016 1
08-01-2016 1
It needs to be done for the previous months as well. PFA sample data.
Please suggest any possible way achieve it.
Thanks,
Ganesh
- Mark as New
- Bookmark
- Subscribe
- Mute
- Subscribe to RSS Feed
- Permalink
- Report Inappropriate Content
try this:
calcluated Dimension: weekstart(Opendate)
Expression: Count(IncidentNumber)
will Count the tickets whichhad been opened in particular week(independant if they are already closed=
- Mark as New
- Bookmark
- Subscribe
- Mute
- Subscribe to RSS Feed
- Permalink
- Report Inappropriate Content
Hi Rudolf,
As per your suggestion implemented the chart, not getting the desired results. PFB highlighted snap shots.
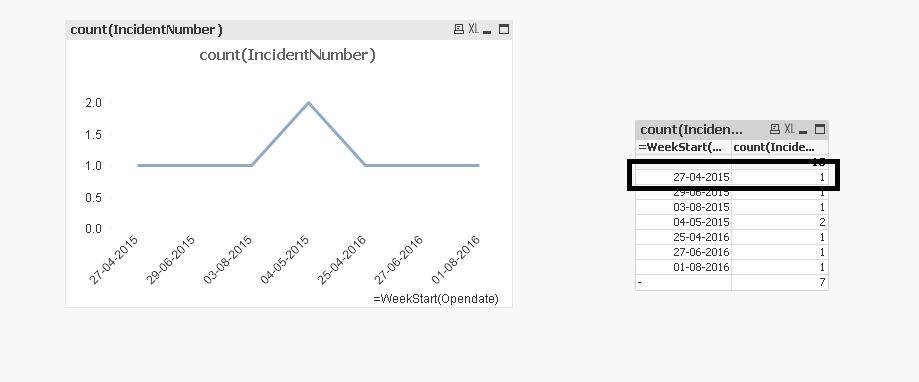
we should get count as 4 for the week 27-04-2015 as per the excel.
Please suggest if any changes required.
Thanks,
Ganesh
- Mark as New
- Bookmark
- Subscribe
- Mute
- Subscribe to RSS Feed
- Permalink
- Report Inappropriate Content
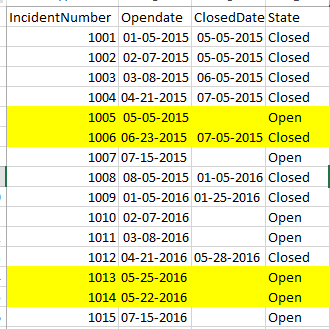
please check the dataformat in your Excel file. when I open your file I get different date formats??
maybe that's causing the Problem??
| 1001 | 01.05.2015 |
| 1002 | 02.07.2015 |
| 1003 | 03.08.2015 |
| 1004 | 04-21-2015 |
| 1005 | 05.05.2015 |
| 1006 | 06-23-2015 |
| 1007 | 07-15-2015 |
| 1008 | 08.05.2015 |
| 1009 | 01.05.2016 |
| 1010 | 02.07.2016 |
| 1011 | 03.08.2016 |
| 1012 | 04-21-2016 |
| 1013 | 05-25-2016 |
| 1014 | 05-22-2016 |
| 1015 | 07-15-2016 |
- Mark as New
- Bookmark
- Subscribe
- Mute
- Subscribe to RSS Feed
- Permalink
- Report Inappropriate Content
Hi Rudolf,
It is not the problem with date format, i altered date formats to make uniformity still not getting the correct count of 3 for the highlighted. PFA capture.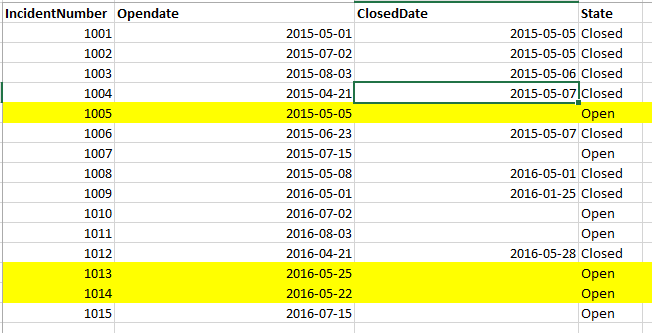
Thanks,
Ganesh
- Mark as New
- Bookmark
- Subscribe
- Mute
- Subscribe to RSS Feed
- Permalink
- Report Inappropriate Content
can you post sample qvw?
- Mark as New
- Bookmark
- Subscribe
- Mute
- Subscribe to RSS Feed
- Permalink
- Report Inappropriate Content
why do you expect 3?
the yellow marked lines are in different year and different weeks
did I missed something?
what do you expect?
- Mark as New
- Bookmark
- Subscribe
- Mute
- Subscribe to RSS Feed
- Permalink
- Report Inappropriate Content
Thanks for asking QVW, PFA
Thanks,
Ganesh