Unlock a world of possibilities! Login now and discover the exclusive benefits awaiting you.
- Qlik Community
- :
- All Forums
- :
- QlikView App Dev
- :
- Re: How to create 2x2 matrix table in qlikview?
- Subscribe to RSS Feed
- Mark Topic as New
- Mark Topic as Read
- Float this Topic for Current User
- Bookmark
- Subscribe
- Mute
- Printer Friendly Page
- Mark as New
- Bookmark
- Subscribe
- Mute
- Subscribe to RSS Feed
- Permalink
- Report Inappropriate Content
How to create 2x2 matrix table in qlikview?
Hi,
I want to create a table structure like below with Age group and Gender where each data cell will display no of customer per age group and gender.
| 0-20 | 21-30 | 31-40 | 41-50 | 51-60 | 60+ | |
| M | 23 | 33 | 43 | 53 | 63 | 73 |
| F | 12 | 12 | 12 | 12 | 12 | 12 |
| Company Owned | 11 | 44 | 77 | 110 | 143 | 176 |
This is my Customer table load script
[Customer]:
LOAD [Customer id],
[Existing Customer],
[Insertion Date],
AGE,
Gender,
[Policy No]
FROM
(ooxml, embedded labels, table is Customer);
- « Previous Replies
-
- 1
- 2
- Next Replies »
Accepted Solutions
- Mark as New
- Bookmark
- Subscribe
- Mute
- Subscribe to RSS Feed
- Permalink
- Report Inappropriate Content
Have a look at the attachment.
- Mark as New
- Bookmark
- Subscribe
- Mute
- Subscribe to RSS Feed
- Permalink
- Report Inappropriate Content
Have a look at the attachment.
- Mark as New
- Bookmark
- Subscribe
- Mute
- Subscribe to RSS Feed
- Permalink
- Report Inappropriate Content
Hi Anindya,
Please see attached QVW.
Use the below calculated dimension.
=if(AGE>=60,'60+',subfield(class(AGE,10),' ',1) &'-'& subfield(class(AGE,10),' ',5))
Cheers
V
If a post helps to resolve your issue, please accept it as a Solution.
- Mark as New
- Bookmark
- Subscribe
- Mute
- Subscribe to RSS Feed
- Permalink
- Report Inappropriate Content
tamilarasu Can u please send me a snapshot of the script and design.I am using Qlikview personal edition.
- Mark as New
- Bookmark
- Subscribe
- Mute
- Subscribe to RSS Feed
- Permalink
- Report Inappropriate Content
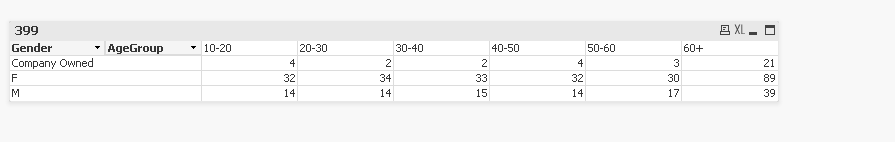
Or Change your Load Script to include AgeGroup and use that as your dimension.
[Customer]:
LOAD [Customer id],
[Existing Customer],
[Insertion Date],
AGE,
if(AGE>=60 , '60+',
if(AGE>=50,'50-60',
if(AGE>=40,'40-50',
if(AGE>=30,'30-40',
if(AGE>=20,'20-30','10-20')))) as AgeGroup,
Gender,
[Policy No]
FROM
(ooxml, embedded labels, table is Customer);
If a post helps to resolve your issue, please accept it as a Solution.
- Mark as New
- Bookmark
- Subscribe
- Mute
- Subscribe to RSS Feed
- Permalink
- Report Inappropriate Content
Instead of a huge nested IF-statement, I would suggest using the IntervalMatch() function instead.
- Mark as New
- Bookmark
- Subscribe
- Mute
- Subscribe to RSS Feed
- Permalink
- Report Inappropriate Content
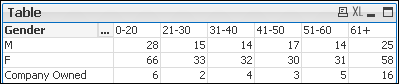
Hi
Try like this
Age:
Load *,
if(AGE<=20,'0-20',
if(AGE<=30,'21-30',
if(AGE<=40,'31-40',
if(AGE<=50,'41-50',
if(AGE<=60,'51-60','61+'))))) as "Age Bucket";
LOAD [Customer id],
[Existing Customer],
[Insertion Date],
AGE,
Gender,
[Policy No]
FROM
[Cross table.xlsx]
(ooxml, embedded labels, table is [Sample data]);
In Front End:
Dimension: Gender and Age Bucket
Exp: Count(Customer Id)
Please close the thread by marking correct answer & give likes if you like the post.
- Mark as New
- Bookmark
- Subscribe
- Mute
- Subscribe to RSS Feed
- Permalink
- Report Inappropriate Content
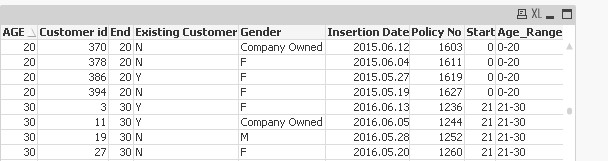
What about using IntervalMatch:
Age_range:
LOAD * INLINE [
Start, End, Age_Range
0, 20, 0-20
21, 30, 21-30
31, 40, 31-40
41, 50, 41-50
51, 60, 51-60
61, 120, 61+
];

Data:
LOAD [Customer id],
     [Existing Customer],
     [Insertion Date],
     AGE,
     Gender,
     [Policy No]
FROM

(ooxml, embedded labels, table is [Sample data]);

IntervalMatch (AGE) LOAD Start, End Resident Age_range;
Results:
- Mark as New
- Bookmark
- Subscribe
- Mute
- Subscribe to RSS Feed
- Permalink
- Report Inappropriate Content
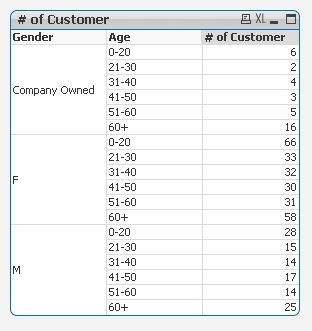
Anindya,
Data:
LOAD [Customer id],
     [Existing Customer],
     [Insertion Date],
     AGE,
     Gender,
     [Policy No],
     if(AGE>=0 and AGE<=20,'0-20',
  if(AGE>20 and AGE<=30,'21-30',
  if(AGE>30 and AGE<=40,'31-40',
  if(AGE>40 and AGE<=50,'41-50',
  if(AGE>50 and AGE<=60,'51-60','61+'))))) as Age_Bucket
FROM

(ooxml, embedded labels, table is [Sample data]);
Pivot table:
Dimensions:
Gender
Age_Bucket
Expression:
Count(Age_Bucket)
- Mark as New
- Bookmark
- Subscribe
- Mute
- Subscribe to RSS Feed
- Permalink
- Report Inappropriate Content
- « Previous Replies
-
- 1
- 2
- Next Replies »