Unlock a world of possibilities! Login now and discover the exclusive benefits awaiting you.
- Qlik Community
- :
- All Forums
- :
- QlikView App Dev
- :
- How to create Bar-chart ?
- Subscribe to RSS Feed
- Mark Topic as New
- Mark Topic as Read
- Float this Topic for Current User
- Bookmark
- Subscribe
- Mute
- Printer Friendly Page
- Mark as New
- Bookmark
- Subscribe
- Mute
- Subscribe to RSS Feed
- Permalink
- Report Inappropriate Content
How to create Bar-chart ?
Hi all
I am new to Qlikview.
How to create Bar-Chart?
Please help.
Accepted Solutions
- Mark as New
- Bookmark
- Subscribe
- Mute
- Subscribe to RSS Feed
- Permalink
- Report Inappropriate Content
- Mark as New
- Bookmark
- Subscribe
- Mute
- Subscribe to RSS Feed
- Permalink
- Report Inappropriate Content
Hi Jones, welcome to qlik world !!
I recommend you to see this material:
https://help.qlik.com/en-US/qlikview/November2017/Subsystems/Client/Content/Bar_Chart.htm
I hope it help's you !
- Mark as New
- Bookmark
- Subscribe
- Mute
- Subscribe to RSS Feed
- Permalink
- Report Inappropriate Content
please post some sample data and your expected result.
- Mark as New
- Bookmark
- Subscribe
- Mute
- Subscribe to RSS Feed
- Permalink
- Report Inappropriate Content
- Mark as New
- Bookmark
- Subscribe
- Mute
- Subscribe to RSS Feed
- Permalink
- Report Inappropriate Content
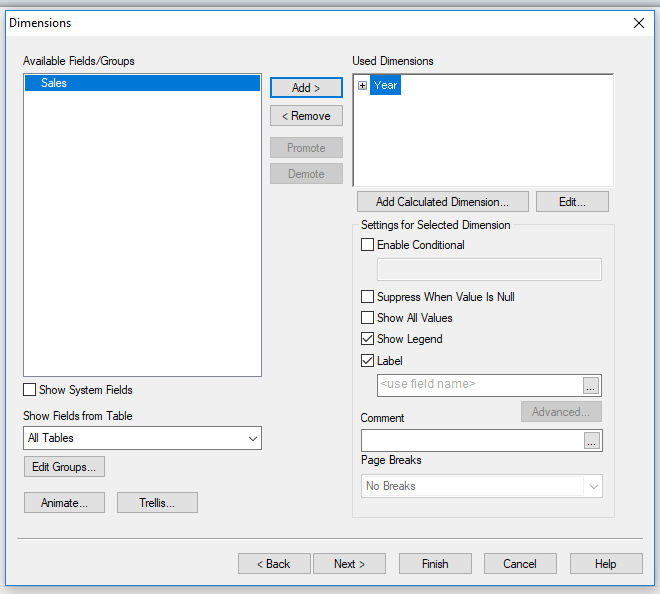
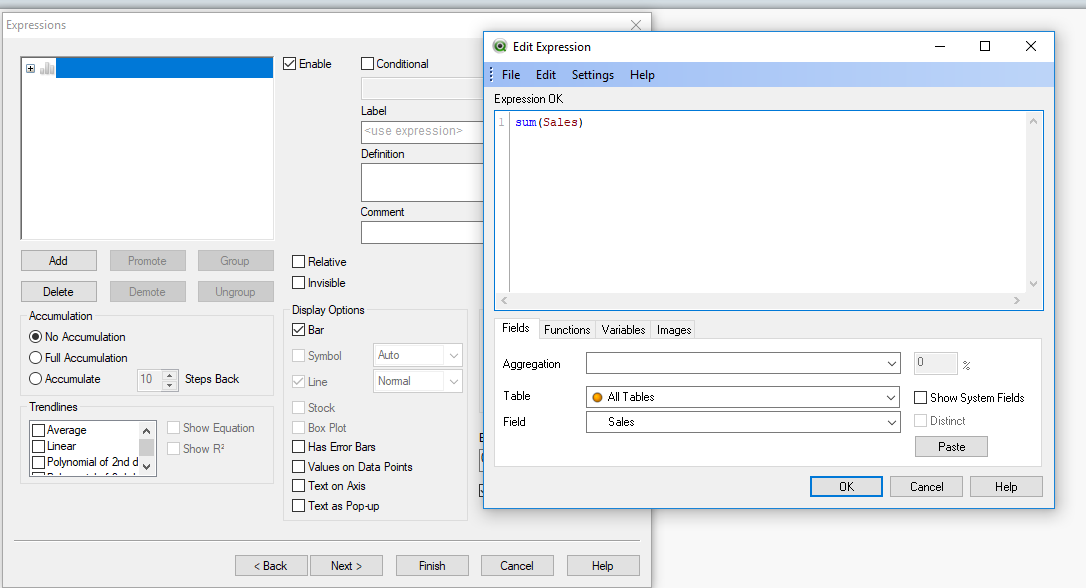
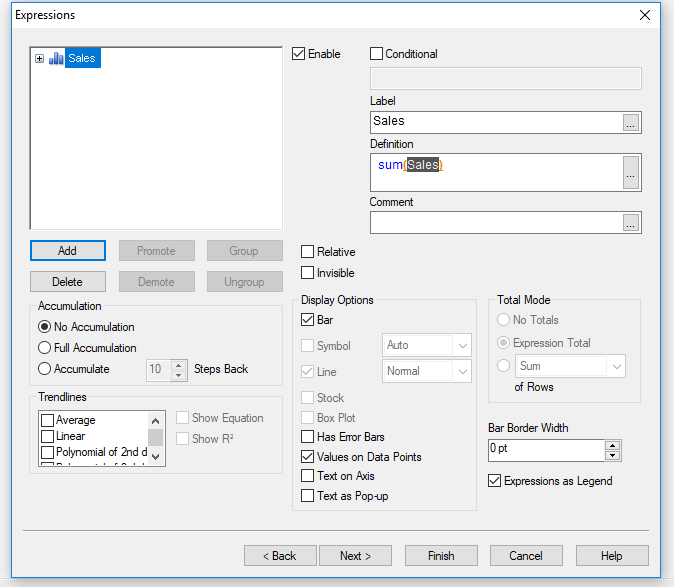
Select Dimension, create expressions.
Ex:
Dimension: Country
Expression1: Sum(Sales)
Expression2: Sum(Costs)...
Select some other options.... finally .. Apply, OK.
Like this, you could create bar charts.
- Mark as New
- Bookmark
- Subscribe
- Mute
- Subscribe to RSS Feed
- Permalink
- Report Inappropriate Content
Hi
You Can refer this
https://help.qlik.com/en-US/qlikview/November2017/Subsystems/Client/Content/Bar_Chart.htm
Thanks,
Mr.Pablo trevisan
- Mark as New
- Bookmark
- Subscribe
- Mute
- Subscribe to RSS Feed
- Permalink
- Report Inappropriate Content
Hi
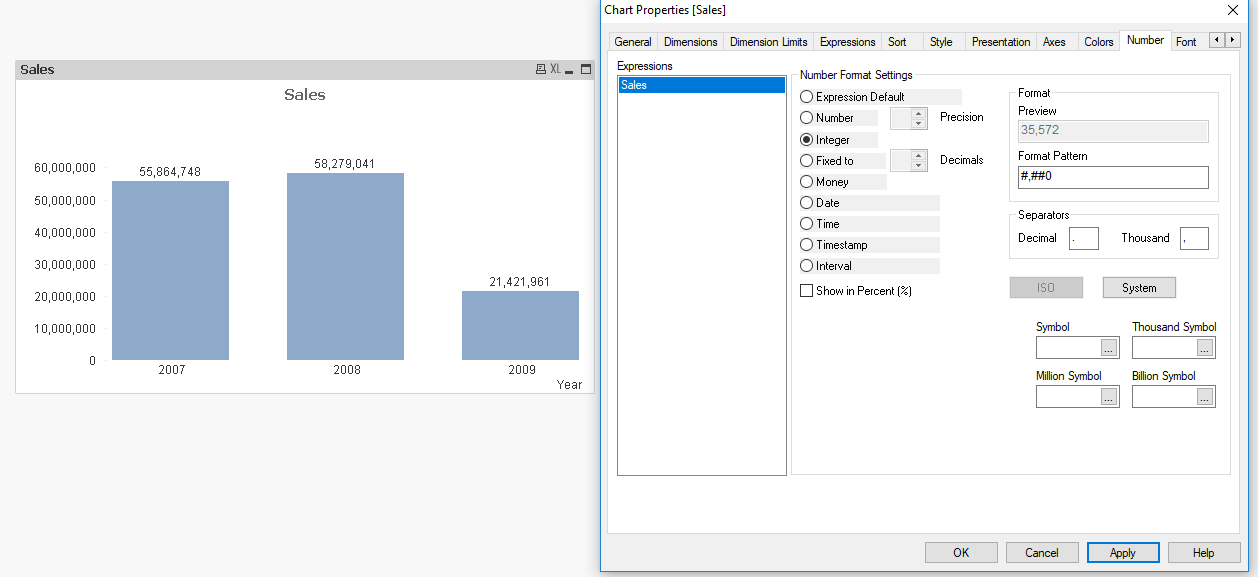
Try like this.
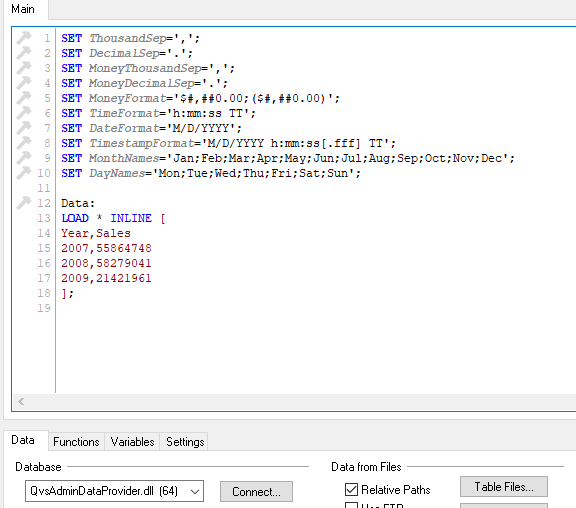
Use this Yearwise Sales inline Table Data and load into Qlikview.
Data:
LOAD * INLINE [
Year,Sales
2007,55864748
2008,58279041
2009,21421961
];
Adjust the options for the axis and scale.
- Mark as New
- Bookmark
- Subscribe
- Mute
- Subscribe to RSS Feed
- Permalink
- Report Inappropriate Content
Hi jonesbrown
Check this app.
- Mark as New
- Bookmark
- Subscribe
- Mute
- Subscribe to RSS Feed
- Permalink
- Report Inappropriate Content
Hi
You can Refer this above content
Very Good Explanation
Thanks
Mr.Arjunarao