Unlock a world of possibilities! Login now and discover the exclusive benefits awaiting you.
- Qlik Community
- :
- All Forums
- :
- QlikView App Dev
- :
- How to create Pie-Chart for each individual dimens...
- Subscribe to RSS Feed
- Mark Topic as New
- Mark Topic as Read
- Float this Topic for Current User
- Bookmark
- Subscribe
- Mute
- Printer Friendly Page
- Mark as New
- Bookmark
- Subscribe
- Mute
- Subscribe to RSS Feed
- Permalink
- Report Inappropriate Content
How to create Pie-Chart for each individual dimension value?
Hi,
I want to create individual pie charts for each value in the dimension.
For example there is an "Asset Group" that can take values - Computer, Laptop, MacBook and Ipad.
Then, I would like to create separate Pie Charts for each asset type i.e. Computer, Laptop.
Please see link below for what I am tyring to achieve. It is taken from "IT Asset Management" demo available on Qlikview website.
In this case, there are only limited asset types so it is easy to create individual pie chart for each of them. When there are multiple values, is it possible to work through a single chart wizard and create pie chart for each dimension value. Please advise.
Thanks,
Rajat
Accepted Solutions
- Mark as New
- Bookmark
- Subscribe
- Mute
- Subscribe to RSS Feed
- Permalink
- Report Inappropriate Content
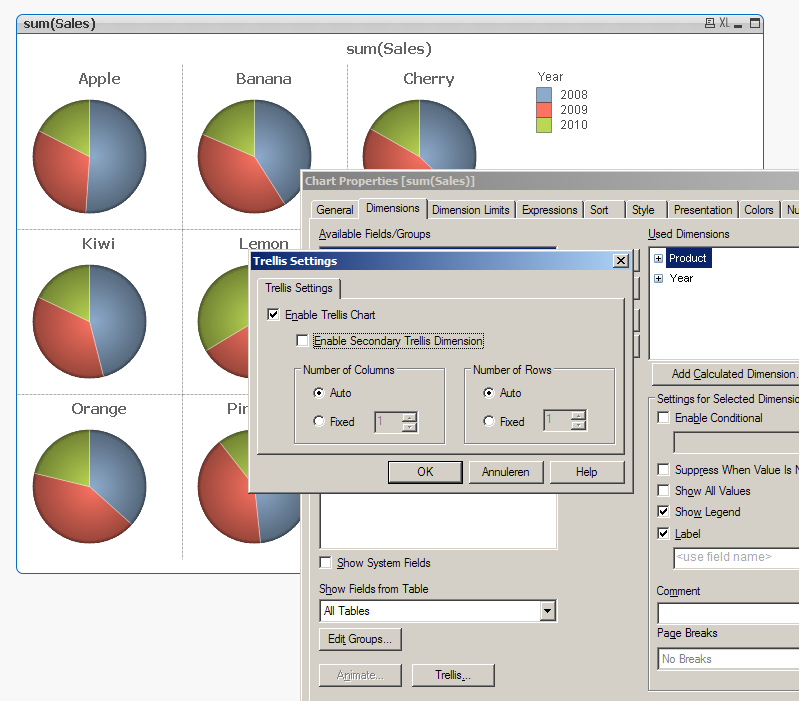
You can use the trellis option on the Dimension tab.
talk is cheap, supply exceeds demand
- Mark as New
- Bookmark
- Subscribe
- Mute
- Subscribe to RSS Feed
- Permalink
- Report Inappropriate Content
You can use the trellis option on the Dimension tab.
talk is cheap, supply exceeds demand
- Mark as New
- Bookmark
- Subscribe
- Mute
- Subscribe to RSS Feed
- Permalink
- Report Inappropriate Content
Thank you Gysbert!!
This is exactly what I was looking for.