Unlock a world of possibilities! Login now and discover the exclusive benefits awaiting you.
- Qlik Community
- :
- All Forums
- :
- QlikView App Dev
- :
- Re: How to create a Bar chart with Month and Year
- Subscribe to RSS Feed
- Mark Topic as New
- Mark Topic as Read
- Float this Topic for Current User
- Bookmark
- Subscribe
- Mute
- Printer Friendly Page
- Mark as New
- Bookmark
- Subscribe
- Mute
- Subscribe to RSS Feed
- Permalink
- Report Inappropriate Content
How to create a Bar chart with Month and Year
Dear all,
I'd like to create a bar chart with the first bars contain the year value and other bars with the month value only of the last year, but the data are in the different columns! And the year value is not necessarily the sum or avg of months, is a specific value. Follow the table.
Is it possible?
Accepted Solutions
- Mark as New
- Bookmark
- Subscribe
- Mute
- Subscribe to RSS Feed
- Permalink
- Report Inappropriate Content
I would make two separate bar charts. the first would have year as the dimension and yearvalue as the expression. the second would have the dimension as =if (year = year(today()), month) and the expression would be monthvalue.
- Mark as New
- Bookmark
- Subscribe
- Mute
- Subscribe to RSS Feed
- Permalink
- Report Inappropriate Content
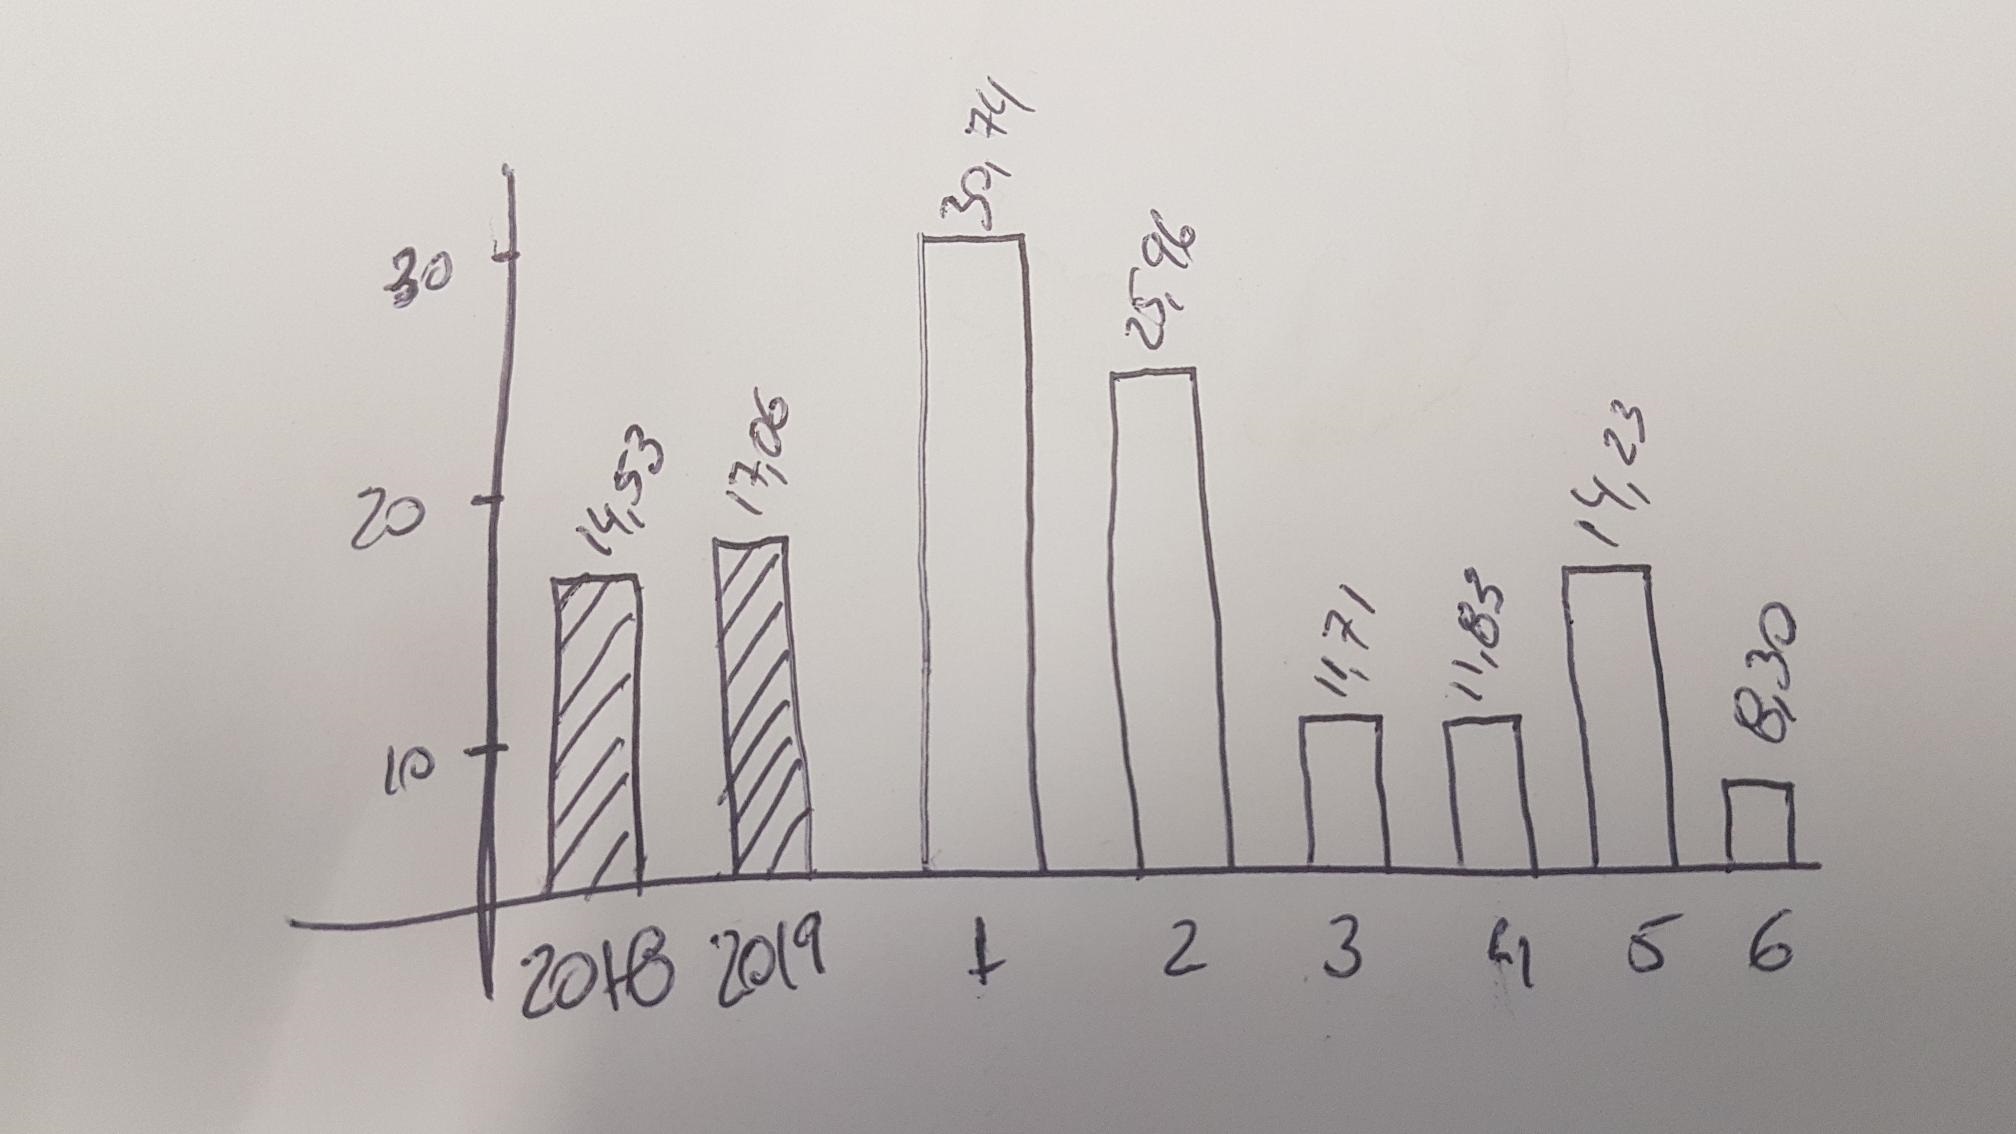
This is the format of bar chart what I need:
- Mark as New
- Bookmark
- Subscribe
- Mute
- Subscribe to RSS Feed
- Permalink
- Report Inappropriate Content
Best I have to try to find some ideas is the Design Blog area:
https://community.qlik.com/t5/Qlik-Design-Blog/bg-p/qlik-design-blog
Use the search dialog there to search all the posts, hopefully you can find something that will help you, I am not really sure what you need here given I do not do a lot of development.
If you have an app going, you may want to attach what you have, as that normally makes it much easier for folks to try to help you get what you need.
Regards,
Brett
I now work a compressed schedule, Tuesday, Wednesday and Thursday, so those will be the days I will reply to any follow-up posts.
- Mark as New
- Bookmark
- Subscribe
- Mute
- Subscribe to RSS Feed
- Permalink
- Report Inappropriate Content
I would make two separate bar charts. the first would have year as the dimension and yearvalue as the expression. the second would have the dimension as =if (year = year(today()), month) and the expression would be monthvalue.