Unlock a world of possibilities! Login now and discover the exclusive benefits awaiting you.
- Qlik Community
- :
- All Forums
- :
- QlikView App Dev
- :
- How to create a chart using the latest reporting d...
- Subscribe to RSS Feed
- Mark Topic as New
- Mark Topic as Read
- Float this Topic for Current User
- Bookmark
- Subscribe
- Mute
- Printer Friendly Page
- Mark as New
- Bookmark
- Subscribe
- Mute
- Subscribe to RSS Feed
- Permalink
- Report Inappropriate Content
How to create a chart using the latest reporting date each month
Hi all,
I'm new to QlikView, I have a requirement to create a dashboard to show sum of inventory value level by Month (but I only want the figure from the latest report per month).
I have a list of inconsistent reporting date, the reporting day is always on a Sunday, but used to be fortnightly now is weekly, so I need to create a new field to pick out only the latest reporting date per month from my reporting date list.
E.g.I want my graph to only show the figures from 2015/11/15, 2015/10/18, 2015/09/27 etc
Any suggestion how this can be done?
Thanks in advance!
| Reporting Date | Total Value |
| 2015/11/15 | $ 123,455.00 |
| 2015/11/08 | $ 345,756.00 |
| 2015/11/01 | $ 324,324.00 |
| 2015/10/25 | $ 654,635.00 |
| 2015/10/18 | $ 346,342.00 |
| 2015/10/11 | $ 424,345.00 |
| 2015/10/04 | $ 435,253.00 |
| 2015/09/27 | $ 354,645.00 |
| 2015/09/20 | $ 242,423.00 |
| 2015/09/13 | $ 546,641.00 |
| 2015/09/06 | $ 742,531.00 |
| 2015/08/30 | $ 547,434.00 |
| 2015/08/23 | $ 437,484.00 |
| 2015/08/16 | $ 564,564.00 |
| 2015/08/09 | $ 123,645.00 |
| 2015/08/02 | $ 567,562.00 |
| 2015/07/26 | $ 464,564.00 |
| 2015/07/19 | $ 565,712.00 |
| 2015/07/12 | $ 546,457.00 |
| 2015/07/05 | $ 575,765.00 |
| 2015/06/28 | $ 435,341.00 |
| 2015/06/21 | $ 123,455.00 |
| 2015/06/14 | $ 345,756.00 |
| 2015/06/07 | $ 324,324.00 |
| 2015/05/31 | $ 654,635.00 |
| 2015/05/24 | $ 346,342.00 |
| 2015/05/17 | $ 424,345.00 |
| 2015/05/10 | $ 435,253.00 |
| 2015/05/03 | $ 354,645.00 |
| 2015/04/26 | $ 242,423.00 |
| 2015/04/19 | $ 437,484.00 |
| 2015/04/12 | $ 564,564.00 |
| 2015/04/05 | $ 123,645.00 |
| 2015/03/29 | $ 567,562.00 |
| 2015/03/22 | $ 464,564.00 |
| 2015/03/15 | $ 565,712.00 |
| 2015/03/08 | $ 546,457.00 |
| 2015/03/01 | $ 242,423.00 |
| 2015/02/22 | $ 437,484.00 |
| 2015/02/15 | $ 564,564.00 |
| 2015/02/08 | $ 123,645.00 |
| 2015/02/01 | $ 345,373.00 |
| 2015/01/18 | $ 123,453.00 |
| 2015/01/04 | $ 333,333.00 |
| 2014/11/30 | $ 222,222.00 |
| 2014/11/02 | $ 111,111.00 |
- Tags:
- new_to_qlikview
Accepted Solutions
- Mark as New
- Bookmark
- Subscribe
- Mute
- Subscribe to RSS Feed
- Permalink
- Report Inappropriate Content
- Mark as New
- Bookmark
- Subscribe
- Mute
- Subscribe to RSS Feed
- Permalink
- Report Inappropriate Content
Hi Susan,
I did it using this script:
tabla:
load date(Reporting_Date) as Reporting_Date, month(Reporting_Date) as reporting_month, year(Reporting_Date) as reporting_year, currency, Total_Value inline
[Reporting_Date, currency, Total_Value
'2015/11/15', '$', '123,455.00'
'2015/11/08', '$', '345,756.00'
'2015/11/01', '$', '324,324.00'
'2015/10/25', '$', '654,635.00'
'2015/10/18', '$', '346,342.00'
'2015/10/11', '$', '424,345.00'
'2015/10/04', '$', '435,253.00'
'2015/09/27', '$', '354,645.00'
'2015/09/20', '$', '242,423.00'
'2015/09/13', '$', '546,641.00'
'2015/09/06', '$', '742,531.00'
'2015/08/30', '$', '547,434.00'
'2015/08/23', '$', '437,484.00'
'2015/08/16', '$', '564,564.00'
'2015/08/09', '$', '123,645.00'
'2015/08/02', '$', '567,562.00'
'2015/07/26', '$', '464,564.00'
'2015/07/19', '$', '565,712.00'
'2015/07/12', '$', '546,457.00'
'2015/07/05', '$', '575,765.00'
'2015/06/28', '$', '435,341.00'
'2015/06/21', '$', '123,455.00'
'2015/06/14', '$', '345,756.00'
'2015/06/07', '$', '324,324.00'
'2015/05/31', '$', '654,635.00'
'2015/05/24', '$', '346,342.00'
'2015/05/17', '$', '424,345.00'
'2015/05/10', '$', '435,253.00'
'2015/05/03', '$', '354,645.00'
'2015/04/26', '$', '242,423.00'
'2015/04/19', '$', '437,484.00'
'2015/04/12', '$', '564,564.00'
'2015/04/05', '$', '123,645.00'
'2015/03/29', '$', '567,562.00'
'2015/03/22', '$', '464,564.00'
'2015/03/15', '$', '565,712.00'
'2015/03/08', '$', '546,457.00'
'2015/03/01', '$', '242,423.00'
'2015/02/22', '$', '437,484.00'
'2015/02/15', '$', '564,564.00'
'2015/02/08', '$', '123,645.00'
'2015/02/01', '$', '345,373.00'
'2015/01/18', '$', '123,453.00'
'2015/01/04', '$', '333,333.00'
'2014/11/30', '$', '222,222.00'
'2014/11/02', '$', '111,111.00'];
left Join (tabla)
LOAD max(date(Reporting_Date)) as Max_Date, reporting_month, reporting_year
Resident tabla group by reporting_month, reporting_year;
final_table:
NoConcatenate load Reporting_Date, currency, Total_Value resident tabla where Max_Date = Reporting_Date;
drop table tabla;
- Mark as New
- Bookmark
- Subscribe
- Mute
- Subscribe to RSS Feed
- Permalink
- Report Inappropriate Content
Hello Susan,
Please find attached file.
Hope this helps.
Regards,
Andrei
- Mark as New
- Bookmark
- Subscribe
- Mute
- Subscribe to RSS Feed
- Permalink
- Report Inappropriate Content
Use the dimensions:
=Month
=Aggr(Max([Reporting Date]), Month)
And for the expression:
=FirstSortedValue([Total Value], -[Reporting Date])
If you don't have a month field, add it (and other calendar fields) during the load using:
LOAD
...
[Reporting Date],
Month([Reporting Date]) As Month,
Year([Reporting Date]) As Year,
MonthName([Reporting Date]) As MonthYear,
...
- Mark as New
- Bookmark
- Subscribe
- Mute
- Subscribe to RSS Feed
- Permalink
- Report Inappropriate Content
u can use in script to set the day starts with sun to sat based value
SET FirstWeekDay=6;
- Mark as New
- Bookmark
- Subscribe
- Mute
- Subscribe to RSS Feed
- Permalink
- Report Inappropriate Content
Thanks Andrei! This is exactly what I'm looking for 
Is it possible to convert the date format of the x-axis to only showing the month&year rather than the whole [Reporting Date]? e.g. 09/2015 or Sep-2015
- Mark as New
- Bookmark
- Subscribe
- Mute
- Subscribe to RSS Feed
- Permalink
- Report Inappropriate Content
Thanks for your help Jonathan, but somehow the expression doesn't work for me 
- Mark as New
- Bookmark
- Subscribe
- Mute
- Subscribe to RSS Feed
- Permalink
- Report Inappropriate Content
Hi Andrei,
I just realised I didn't do it correctly, for some reason your expression "FirstSortedValue([Total Value],-aggr(max([Reporting Date]),Month,Year))" doesn't work for me as well, it's giving me errors.
I actually don't have Total Value in my table, my Total Value is the SUM([Unit RRP]*Quantity), do you know why expression doesn't work when I substituted [Total Value] with SUM([Unit RRP]*Quantity)?
ie. Firstsortedvalue(Sum([Unit RRP]*Quantity),-aggr(max([Reporting Date]),Month,Year)
- Mark as New
- Bookmark
- Subscribe
- Mute
- Subscribe to RSS Feed
- Permalink
- Report Inappropriate Content
Hi Crusader_,
Can you please have a look at my attachment example?
Would you know why the below expression doesn't work when I split the Total Value column in my report into 'Unit RRP' and Quantity?
Expression: Firstsortedvalue([Total Value]),-aggr(max([Reporting Date]),Month,Year)
Thanks again in advance!
Susan
- Mark as New
- Bookmark
- Subscribe
- Mute
- Subscribe to RSS Feed
- Permalink
- Report Inappropriate Content
Hi Susan,
First of all please confirm that there everything okay with data.
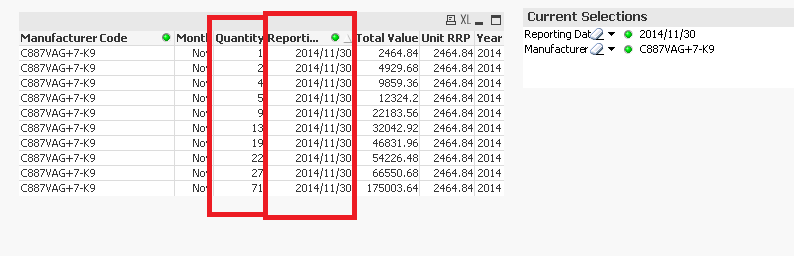
Here what you have in your test application (see attached PNG). For 1 product in 1 day you have several different rows with different qty.
Anyway I did some script changes with end month flag.
Please find attached.
Hope this helps.
Regards,
Andrei