Unlock a world of possibilities! Login now and discover the exclusive benefits awaiting you.
- Qlik Community
- :
- All Forums
- :
- QlikView App Dev
- :
- How to create dimension from excel date and how to...
- Subscribe to RSS Feed
- Mark Topic as New
- Mark Topic as Read
- Float this Topic for Current User
- Bookmark
- Subscribe
- Mute
- Printer Friendly Page
- Mark as New
- Bookmark
- Subscribe
- Mute
- Subscribe to RSS Feed
- Permalink
- Report Inappropriate Content
How to create dimension from excel date and how to compare previous vs current year sales
Hi!
From my data sample, how can create a dimension (for example product_sales) that contains sales data?
The chart expresions must be something like grouping for year, sum of each product . Ialso need to create expresions that allow me calculate de difference between sales of the selected year respect to the previous one, as well as between the first year and the last year of the my data.
Thanks in advance for help
- Mark as New
- Bookmark
- Subscribe
- Mute
- Subscribe to RSS Feed
- Permalink
- Report Inappropriate Content
Hi Dude,
Hope ,you forgot to attach your input excel file so it is difficult to understand your requirement for us.
1) =Aggr(Sum(Sales)Year)
2) =Aggr(Sum(Sales)Product)
3) Sum(Sales) Current year vs previous year
else
example like below
Consider you have below script..
================
Sales:
Load * Inline
[
Customer, Sales, Year
A, 100, 2012
A, 120, 2013
B, 90, 2012
B, 110, 2013
C, 150, 2012
C, 110, 2013
];
===========================
You can show CY vs LY/PY sales growth as below
Create a Straight Table
Dimension
Customer
Expressions
2012 Sales
SUM({<Year = {2012}>}Sales)
2013 Sales
SUM({<Year = {2013}>}Sales)
Growth
SUM({<Year = {2013}>}Sales)/SUM({<Year = {2012}>}Sales)-1
Don't forget to change Number formatting of Growth to percentage from Properties = Number Tab
4)
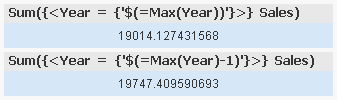
Sum( {<Year= Max(Sales Year)>}Sales) This will give last year sales
Sum( {<Year= Min(Sales Year)>}Sales) This will give First/Starting Year sales
Please close the thread if you thought you got solution for your query
- Mark as New
- Bookmark
- Subscribe
- Mute
- Subscribe to RSS Feed
- Permalink
- Report Inappropriate Content
First of all,I must thank you for your reply!
Please, check that my sample file is included in my question (file name question.xlsx).
Regards
- Mark as New
- Bookmark
- Subscribe
- Mute
- Subscribe to RSS Feed
- Permalink
- Report Inappropriate Content
Hi Francis,
so sorry for my mistake, i didn't observe your attachment.
Actually i was unable to download attachments, Due to some restrictions in my office . sure i will try in my personal machine and will give reply ASAP.
- Mark as New
- Bookmark
- Subscribe
- Mute
- Subscribe to RSS Feed
- Permalink
- Report Inappropriate Content
Really your interest for help
I advence the data
As you can see, i have 4 product fields, I need one dimension containig those fields. Done this, do the calculations indicated in my first post
Cod_empl Year Product_1 Product_2 Product_3 Product_4
1 2018 193 130 175 192
2 2018 125 110 142 165
3 2018 100 123 104 121
1 2017 129 162 111 137
2 2017 105 168 105 125
3 2017 191 166 196 163
1 2016 132 124 188 129
3 2016 227 196 133 206
Regards!!