Unlock a world of possibilities! Login now and discover the exclusive benefits awaiting you.
- Qlik Community
- :
- All Forums
- :
- QlikView App Dev
- :
- How to create some text adjustment in bar graph?
- Subscribe to RSS Feed
- Mark Topic as New
- Mark Topic as Read
- Float this Topic for Current User
- Bookmark
- Subscribe
- Mute
- Printer Friendly Page
- Mark as New
- Bookmark
- Subscribe
- Mute
- Subscribe to RSS Feed
- Permalink
- Report Inappropriate Content
How to create some text adjustment in bar graph?
Hi,
I have a design of a bar graph that I have to implement, but some textual design pattern that I don't know how to implement it.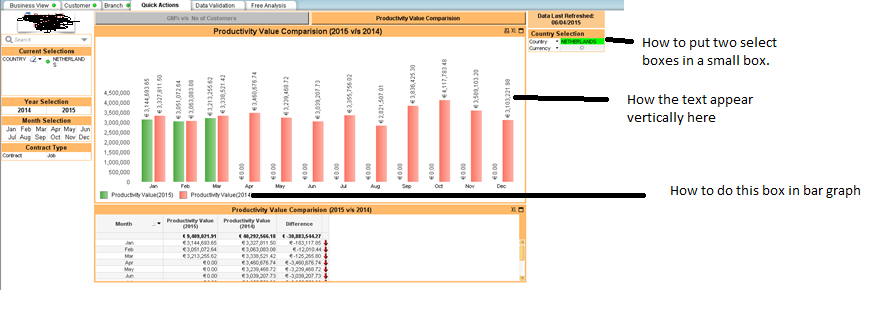
My questions are marked in the picture. Please help me in this regard.
Thanks,
Sandip Ghosh.
- « Previous Replies
-
- 1
- 2
- Next Replies »
- Mark as New
- Bookmark
- Subscribe
- Mute
- Subscribe to RSS Feed
- Permalink
- Report Inappropriate Content
Hi Sandip,
For listboxes use Multi Box object and select the dimensions you want to display.
For horizontal number display on bars
Chart Properties -> Measures -> Select Values on Datapoints option
Chart Properties -> Presentation-> Select Vertical option
For Legend
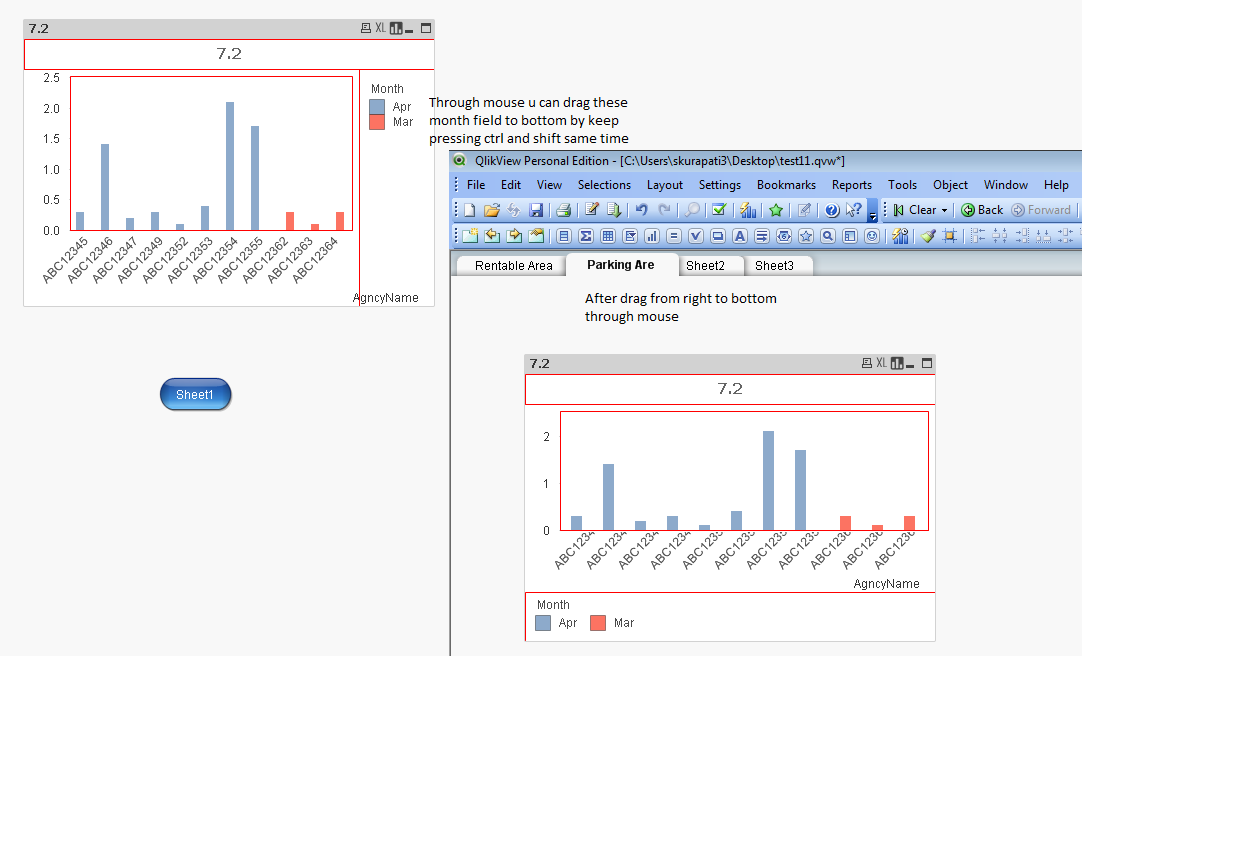
Click on the chart -> Hold Ctrl + Shift buttons and drag the legend to the bottom of the chart until you see the Red rectangle border.
Hope this helps you.
Regards,
Jagan.
- Mark as New
- Bookmark
- Subscribe
- Mute
- Subscribe to RSS Feed
- Permalink
- Report Inappropriate Content
1.How to two selected boxes in small box.
--As per my knowledge, in multi box its not possible to show two selected values.
2.How text appears vertically here .
--go to chart properties and axis their you will find the dimension and secondary dimension axis format ..select vertical.
3.how to do this
--- click on chart and press shift+control together ...now the individual areas for chart will appear ..drag it to required place
- Mark as New
- Bookmark
- Subscribe
- Mute
- Subscribe to RSS Feed
- Permalink
- Report Inappropriate Content
try these,
1.How to put two select box's in a sample box ---> use multi box add ur filters in this multi box.
2. How the text appears vertically here---> show values on data point from Expressions tab & from presentation tab---Values on Data point-- here there is heck box VERTICAL,check this.
3.How to do this in bar graph ---> if ur looking for to show legends in graph,from presentation tab ---LEGEND click check box SHOW LEGEND and if ur looking to move those legends in in x-axis,press CTRL+SHOFT from ur key board both at a time and y using the mouse u can drag those legends to bottom & move side by side.
- Mark as New
- Bookmark
- Subscribe
- Mute
- Subscribe to RSS Feed
- Permalink
- Report Inappropriate Content
HI,
For third question I have tried it, but I can't do so by pressing CTRL + SHIFT key . So can u give me some screen shot or give me a video for that? it will be very helpful to me.
Thanks,
Sandip Ghosh
- Mark as New
- Bookmark
- Subscribe
- Mute
- Subscribe to RSS Feed
- Permalink
- Report Inappropriate Content
try like this,
3.How to do this in bar graph ---> if ur looking for to show legends in graph,from presentation tab ---LEGEND click check box SHOW LEGEND and if ur looking to move those legends in in x-axis,press CTRL+SHOFT from ur key board both at a time and y using the mouse u can drag those legends to bottom & move side by side.
- Mark as New
- Bookmark
- Subscribe
- Mute
- Subscribe to RSS Feed
- Permalink
- Report Inappropriate Content
Hi Sandip,
Try like this
1. Click on the chart header or somewhere in the chart
2. Hold Ctrl + Shift buttons together
3. Now the legend is highlighted in Red border
4. Now drag the legend portion to the bottom of the chart and drop when you see the Red Rectangle in the chart
Check this video in youtube.
youtube.com/watch?v=SbZjySxc89g
Hope this helps you.
Regards,
Jagan.
- Mark as New
- Bookmark
- Subscribe
- Mute
- Subscribe to RSS Feed
- Permalink
- Report Inappropriate Content
- Mark as New
- Bookmark
- Subscribe
- Mute
- Subscribe to RSS Feed
- Permalink
- Report Inappropriate Content
can u mark as correct,if u r happy with output.
- Mark as New
- Bookmark
- Subscribe
- Mute
- Subscribe to RSS Feed
- Permalink
- Report Inappropriate Content
Hi,
Can the legends be placed side by side?
- « Previous Replies
-
- 1
- 2
- Next Replies »