Unlock a world of possibilities! Login now and discover the exclusive benefits awaiting you.
- Qlik Community
- :
- All Forums
- :
- QlikView App Dev
- :
- How to create the red boundary line in bar chart
- Subscribe to RSS Feed
- Mark Topic as New
- Mark Topic as Read
- Float this Topic for Current User
- Bookmark
- Subscribe
- Mute
- Printer Friendly Page
- Mark as New
- Bookmark
- Subscribe
- Mute
- Subscribe to RSS Feed
- Permalink
- Report Inappropriate Content
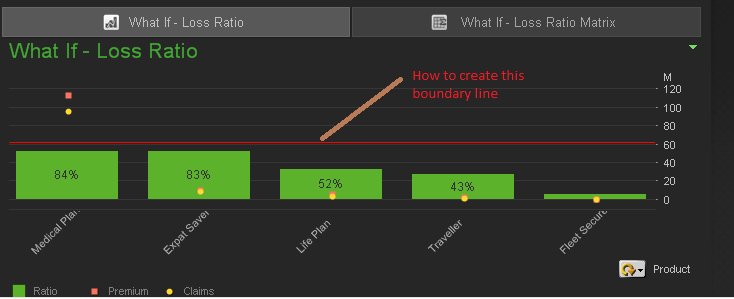
How to create the red boundary line in bar chart
How to create the red boundary line in bar chart like the attached image? Actually my client want me to show it as target line. But I cannot understand , how to do it. Please help me about it.
Accepted Solutions
- Mark as New
- Bookmark
- Subscribe
- Mute
- Subscribe to RSS Feed
- Permalink
- Report Inappropriate Content
HI Sandip,
that looks like a reference line. You can create one on the Presentation Tab of you chart.
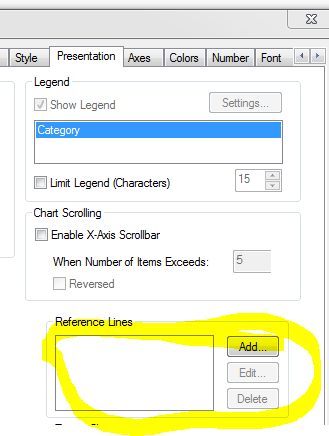
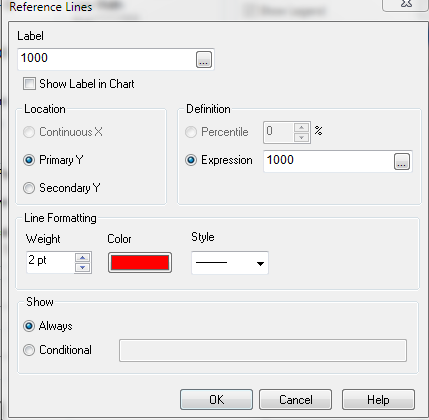
Click ADD, select the required values, Color, expression etc
and you get:
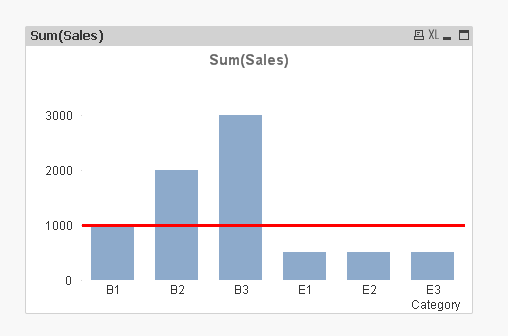
HTH - Andy
- Mark as New
- Bookmark
- Subscribe
- Mute
- Subscribe to RSS Feed
- Permalink
- Report Inappropriate Content
In presentatin tab there is a Reference line box, add your expression there.
- Mark as New
- Bookmark
- Subscribe
- Mute
- Subscribe to RSS Feed
- Permalink
- Report Inappropriate Content
Hello Sandip,
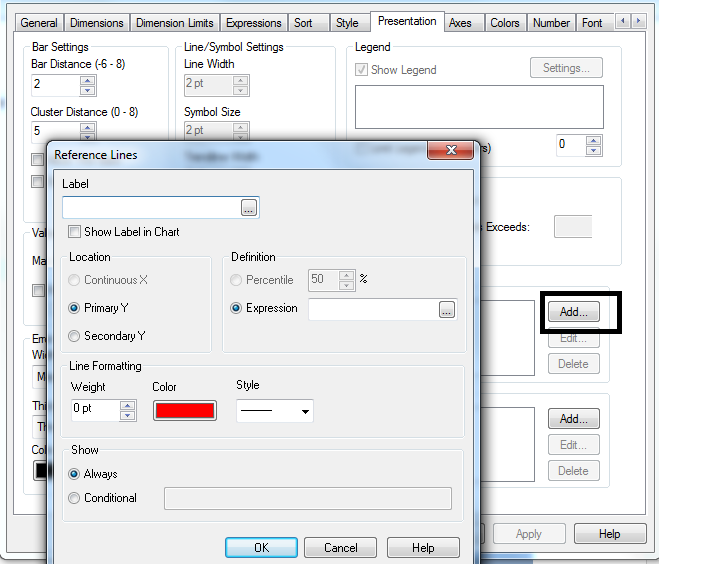
To add reference line in your chart, follow this:
Chart properties--> Presentation Tab--> Click on Add button. See below image:
- Mark as New
- Bookmark
- Subscribe
- Mute
- Subscribe to RSS Feed
- Permalink
- Report Inappropriate Content
HI Sandip,
that looks like a reference line. You can create one on the Presentation Tab of you chart.
Click ADD, select the required values, Color, expression etc
and you get:
HTH - Andy
- Mark as New
- Bookmark
- Subscribe
- Mute
- Subscribe to RSS Feed
- Permalink
- Report Inappropriate Content
Presentation tab -> Go to Reference lines --> Add Default or calculated vale in Expression
- Mark as New
- Bookmark
- Subscribe
- Mute
- Subscribe to RSS Feed
- Permalink
- Report Inappropriate Content
HI sandip
Andy replied with clear picture of how to do it. Just follow his steps I think it's enough for your query
- Mark as New
- Bookmark
- Subscribe
- Mute
- Subscribe to RSS Feed
- Permalink
- Report Inappropriate Content
Do as per the instructions given by andy.
- Mark as New
- Bookmark
- Subscribe
- Mute
- Subscribe to RSS Feed
- Permalink
- Report Inappropriate Content
in expressions tab there is trend lines option. if you select there average then line will get in the chart
thanks and regards
Rasool
- Mark as New
- Bookmark
- Subscribe
- Mute
- Subscribe to RSS Feed
- Permalink
- Report Inappropriate Content
Presentation tab -> Go to Reference lines --> Add -->give any value based on your refernce line -->60