Unlock a world of possibilities! Login now and discover the exclusive benefits awaiting you.
- Qlik Community
- :
- All Forums
- :
- QlikView App Dev
- :
- Re: How to create this chart
- Subscribe to RSS Feed
- Mark Topic as New
- Mark Topic as Read
- Float this Topic for Current User
- Bookmark
- Subscribe
- Mute
- Printer Friendly Page
- Mark as New
- Bookmark
- Subscribe
- Mute
- Subscribe to RSS Feed
- Permalink
- Report Inappropriate Content
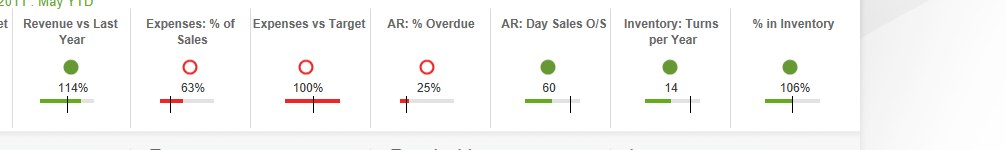
How to create this chart
Hi
i want to create some chart like below. i am not sure how i can do it. find the below in internet. Please upload some sample qvw file which contains this type of charts. TIA
Accepted Solutions
- Mark as New
- Bookmark
- Subscribe
- Mute
- Subscribe to RSS Feed
- Permalink
- Report Inappropriate Content
You can download it here: https://demos.qlik.com/qlikview/ExecutiveDashboardQV?page=5. The demo workbook unfortunately contains no data, but you can at least see which objects are used and the expressions that were used.
talk is cheap, supply exceeds demand
- Mark as New
- Bookmark
- Subscribe
- Mute
- Subscribe to RSS Feed
- Permalink
- Report Inappropriate Content
thts great., thanks much
- Mark as New
- Bookmark
- Subscribe
- Mute
- Subscribe to RSS Feed
- Permalink
- Report Inappropriate Content
Hi Gysbert,
any idea how i can fix that baroffset to 100 or my max value in my version bars for both 27 and 95 % looks similar. i need to get the remaining white portion in my chart as highlighted below. Please advise. thnx
