Unlock a world of possibilities! Login now and discover the exclusive benefits awaiting you.
- Qlik Community
- :
- All Forums
- :
- QlikView App Dev
- :
- Re: How to create this table in Qlikview?
- Subscribe to RSS Feed
- Mark Topic as New
- Mark Topic as Read
- Float this Topic for Current User
- Bookmark
- Subscribe
- Mute
- Printer Friendly Page
- Mark as New
- Bookmark
- Subscribe
- Mute
- Subscribe to RSS Feed
- Permalink
- Report Inappropriate Content
How to create this table in Qlikview?
Hi All,
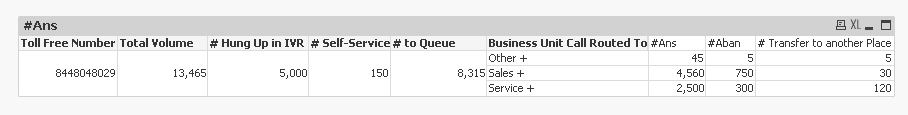
Basically, I want to show the total volume of calls for the toll free number, within that total volume, how many are hang ups, self-service and get-into-queue calls. Then I want to show how many calls are answered, abandoned or transfer to another place in that get-into-queue calls per business unit. I also want to add intent as another bucket under business unit (plus sign as in pivot table).
How do I create this table or something similar? Or is there a better way to show to data?

Thank you for your inputs.
- Mark as New
- Bookmark
- Subscribe
- Mute
- Subscribe to RSS Feed
- Permalink
- Report Inappropriate Content
This?
- Mark as New
- Bookmark
- Subscribe
- Mute
- Subscribe to RSS Feed
- Permalink
- Report Inappropriate Content
Yes Sunny, and also the plus signs on Sales, Service and Other indicate that it can be expanded to Intent.
For example:
Sale -
Getting Quote
Subscribe
Service -
Cancel Policy
Renewal
Other -
Question about Discount
- Mark as New
- Bookmark
- Subscribe
- Mute
- Subscribe to RSS Feed
- Permalink
- Report Inappropriate Content
Would you be able to provide a sample to look at?
- Mark as New
- Bookmark
- Subscribe
- Mute
- Subscribe to RSS Feed
- Permalink
- Report Inappropriate Content
Hi Sunny,
I have attached a sample in Excel. You can see sample data in the data tab, final tab is what I want which I manually format from pivot sheet.
Thank you for your help.