Unlock a world of possibilities! Login now and discover the exclusive benefits awaiting you.
- Qlik Community
- :
- All Forums
- :
- QlikView App Dev
- :
- How to get correct data?
- Subscribe to RSS Feed
- Mark Topic as New
- Mark Topic as Read
- Float this Topic for Current User
- Bookmark
- Subscribe
- Mute
- Printer Friendly Page
- Mark as New
- Bookmark
- Subscribe
- Mute
- Subscribe to RSS Feed
- Permalink
- Report Inappropriate Content
How to get correct data?
Hi,
Is it possible to create
1) How many organisations there are per week?
2) Organisation split per week?
I tried but it seems I have doubt on result. Please help with correct expressions?
Thanks.
- Tags:
- new_to_qlikview
- « Previous Replies
-
- 1
- 2
- Next Replies »
- Mark as New
- Bookmark
- Subscribe
- Mute
- Subscribe to RSS Feed
- Permalink
- Report Inappropriate Content
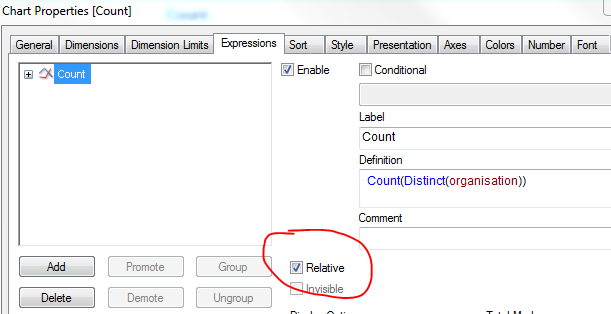
Do I need to use Count(Distinct(organisation)) instead of Count(Distinct(StudentID))
- Mark as New
- Bookmark
- Subscribe
- Mute
- Subscribe to RSS Feed
- Permalink
- Report Inappropriate Content
yes you should, and week as dimension and not organisation.
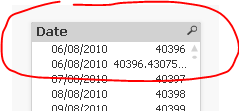
You also have time in your date field, so you need to ceil it for example to get rid of time. That is why your date field does not match the calender date you are using.
- Mark as New
- Bookmark
- Subscribe
- Mute
- Subscribe to RSS Feed
- Permalink
- Report Inappropriate Content
Thanks. If I want to show the information in table and graph means. could you suggets will Pivot and Bar suits or Pivot and Line chart?
- Mark as New
- Bookmark
- Subscribe
- Mute
- Subscribe to RSS Feed
- Permalink
- Report Inappropriate Content
Bar chart sort by count organisation desc would be my choice
- Mark as New
- Bookmark
- Subscribe
- Mute
- Subscribe to RSS Feed
- Permalink
- Report Inappropriate Content
Thakns. Actually I have to show
a)No of organisations per week
b) organisation split per week
If I want to display organisation on vertical axis how can I do this?
- Mark as New
- Bookmark
- Subscribe
- Mute
- Subscribe to RSS Feed
- Permalink
- Report Inappropriate Content
try a grid chart with wee, organisation as dimensions and Count(Distinct(organisation)) as expression. For the organisation split per week, maybe a stacked bar chart would be a good choice.
- Mark as New
- Bookmark
- Subscribe
- Mute
- Subscribe to RSS Feed
- Permalink
- Report Inappropriate Content
Thanks. That means do Ineed to do two charts. If so will the dimensions and expressions are same for two charts?
- Mark as New
- Bookmark
- Subscribe
- Mute
- Subscribe to RSS Feed
- Permalink
- Report Inappropriate Content
Depending on your customer needs, yes it will be 2 charts. Expression may be the same, just tick relative in the split one. But you need to try it out yourself and decide what suits your needs.
- Mark as New
- Bookmark
- Subscribe
- Mute
- Subscribe to RSS Feed
- Permalink
- Report Inappropriate Content
please find attached when i use grid chart it is showing ...
- « Previous Replies
-
- 1
- 2
- Next Replies »