Unlock a world of possibilities! Login now and discover the exclusive benefits awaiting you.
- Qlik Community
- :
- All Forums
- :
- QlikView App Dev
- :
- How to highlight Background color across a bunch o...
- Subscribe to RSS Feed
- Mark Topic as New
- Mark Topic as Read
- Float this Topic for Current User
- Bookmark
- Subscribe
- Mute
- Printer Friendly Page
- Mark as New
- Bookmark
- Subscribe
- Mute
- Subscribe to RSS Feed
- Permalink
- Report Inappropriate Content
How to highlight Background color across a bunch of expressions
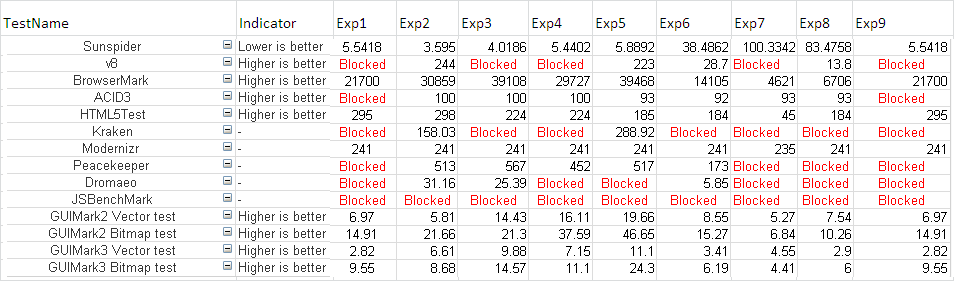
I have two dimension and 8 expressions in a pivot table.
I am trying to highlight the background color for the expression that has the highest value of all the expressions on each row for that dimension value (TestName). So, for Sunspider, it would be Exp7, I would want a blue background for that best one. I am not sure how to consider the 8 expressions columns on a row in the code as a set.
Anybody have any ideas how to do that?
- Tags:
- new_to_qlikview
- « Previous Replies
-
- 1
- 2
- Next Replies »
Accepted Solutions
- Mark as New
- Bookmark
- Subscribe
- Mute
- Subscribe to RSS Feed
- Permalink
- Report Inappropriate Content
If you allow the pivot table to create the expressions, as opposed to manullay creating the expressions in your example, you can use the Aggr function to find the maximum across your dimension, and then compare that to your results within the Background Color of your expression.
If( Sum(Results) = Aggr(NODISTINCT Max(Results),TestName), LightBlue() )
I've attached your qvw example to show this.
- Mark as New
- Bookmark
- Subscribe
- Mute
- Subscribe to RSS Feed
- Permalink
- Report Inappropriate Content
Hey Hi,
As you are using pivot table, goto the exression tab nad click the '+' sign at the start of each Expression, there you will find the background color option >> write an exression over there(eg if(sum(Sales)>10000,green(),red())
In case of straight table, use Visual Cues.
Hope this helps
Regards
- Mark as New
- Bookmark
- Subscribe
- Mute
- Subscribe to RSS Feed
- Permalink
- Report Inappropriate Content
Hi,
See the attached sample file there you find the code for Background and text color also. Just click on + sign on front of the expression and you find several option select Background Color to change back color,to change text color select Text Color and write code there.
Regards
Anand
- Mark as New
- Bookmark
- Subscribe
- Mute
- Subscribe to RSS Feed
- Permalink
- Report Inappropriate Content
Thanks for the input. setting the background color is understood, how to compare accross expressions is the question I have.
- Mark as New
- Bookmark
- Subscribe
- Mute
- Subscribe to RSS Feed
- Permalink
- Report Inappropriate Content
Hi,
In this case you need to create a different variables for the expression and need to check the condotion that you see on the Background option from there same like check the condition and give color to the condition. Do you have any sample if so please provide it goes so easy.
Regards,
Anand
- Mark as New
- Bookmark
- Subscribe
- Mute
- Subscribe to RSS Feed
- Permalink
- Report Inappropriate Content
Here is Qlikview file that, one chart. Trying to color background light blue for the best in class on each row.
- Mark as New
- Bookmark
- Subscribe
- Mute
- Subscribe to RSS Feed
- Permalink
- Report Inappropriate Content
Are you suggesting turn each expression formula into a variable and then do an:
if ( NumMax( $(vExpr1), $(vExpr2), $(vExpr3),... = $vExpr1 ), rgb(255,0,.0) ) in the Background?
- Mark as New
- Bookmark
- Subscribe
- Mute
- Subscribe to RSS Feed
- Permalink
- Report Inappropriate Content
If you allow the pivot table to create the expressions, as opposed to manullay creating the expressions in your example, you can use the Aggr function to find the maximum across your dimension, and then compare that to your results within the Background Color of your expression.
If( Sum(Results) = Aggr(NODISTINCT Max(Results),TestName), LightBlue() )
I've attached your qvw example to show this.
- Mark as New
- Bookmark
- Subscribe
- Mute
- Subscribe to RSS Feed
- Permalink
- Report Inappropriate Content
Seems that would be perfect… Missed a point somewhere, did not know we could put dimension across the top on the horizontal… Not sure how to do that yet, how did you do it?
- Mark as New
- Bookmark
- Subscribe
- Mute
- Subscribe to RSS Feed
- Permalink
- Report Inappropriate Content
Think I figured it out, select, get the hand and do a drag and drop of sorts…. Hmmm
- « Previous Replies
-
- 1
- 2
- Next Replies »