Unlock a world of possibilities! Login now and discover the exclusive benefits awaiting you.
- Qlik Community
- :
- All Forums
- :
- QlikView App Dev
- :
- How to keep all the column Value in charts
- Subscribe to RSS Feed
- Mark Topic as New
- Mark Topic as Read
- Float this Topic for Current User
- Bookmark
- Subscribe
- Mute
- Printer Friendly Page
- Mark as New
- Bookmark
- Subscribe
- Mute
- Subscribe to RSS Feed
- Permalink
- Report Inappropriate Content
How to keep all the column Value in charts
Hi all
Below is my tableA
lang, year, amt
tamil, 2013,3409
english,2013,8953
tamil,2014,4852
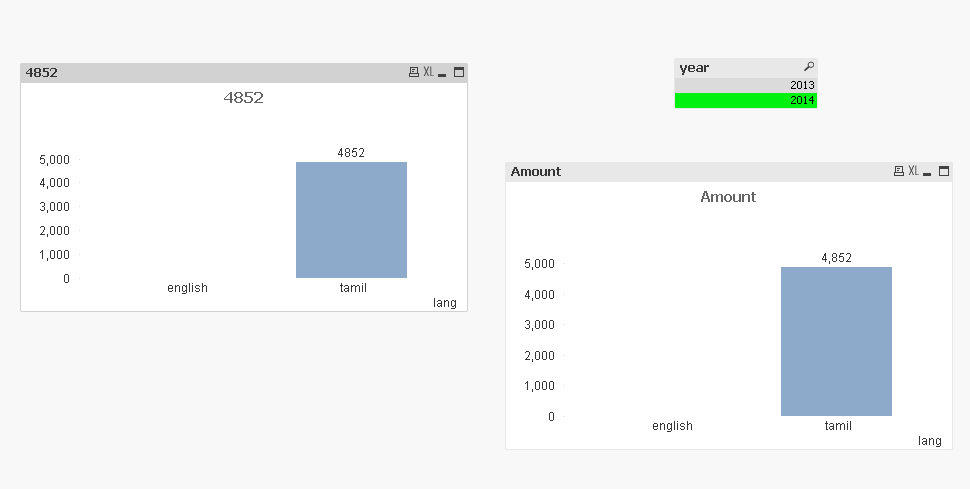
in chart if i select year 2014 i am getting only lang 'tamil' but i want both with the amt as 0 for english.
TIA
- Mark as New
- Bookmark
- Subscribe
- Mute
- Subscribe to RSS Feed
- Permalink
- Report Inappropriate Content
there is no combination between year 2014 and english
so if should be, you have to generate for all lang and all year a line 0 as amt.
and deselect suppress null values in presentation tab
- Mark as New
- Bookmark
- Subscribe
- Mute
- Subscribe to RSS Feed
- Permalink
- Report Inappropriate Content
Hi,
you can try something like .
Expression : =sum(amt)+ Avg({1} 0)
and unchecked Suppress Zero-Values option in presentation tab..
Thanks,
Mukram.
- Mark as New
- Bookmark
- Subscribe
- Mute
- Subscribe to RSS Feed
- Permalink
- Report Inappropriate Content
Not sure, I understand your question? What are the measures you used. Will you provide sample result set?
- Mark as New
- Bookmark
- Subscribe
- Mute
- Subscribe to RSS Feed
- Permalink
- Report Inappropriate Content
Hi Anil,
dimension is Lang
Exp is sum(amt)
TIA
- Mark as New
- Bookmark
- Subscribe
- Mute
- Subscribe to RSS Feed
- Permalink
- Report Inappropriate Content
Still, Not make sense to me. Because the English comes from 2014 2013 and your filter looks 2014. Why you want to club them. May be look Mohammed Response..