Unlock a world of possibilities! Login now and discover the exclusive benefits awaiting you.
- Qlik Community
- :
- All Forums
- :
- QlikView App Dev
- :
- How to limit Dimensions
- Subscribe to RSS Feed
- Mark Topic as New
- Mark Topic as Read
- Float this Topic for Current User
- Bookmark
- Subscribe
- Mute
- Printer Friendly Page
- Mark as New
- Bookmark
- Subscribe
- Mute
- Subscribe to RSS Feed
- Permalink
- Report Inappropriate Content
How to limit Dimensions
I have a two dimension line chart.I want to limit the number of dimensions shown.
When i use Dimension Limits : for option : First it shows current calculations but when I show Largest the calculations go haywire.
I want to show the latest 'n' number of Dimension.
Please help.
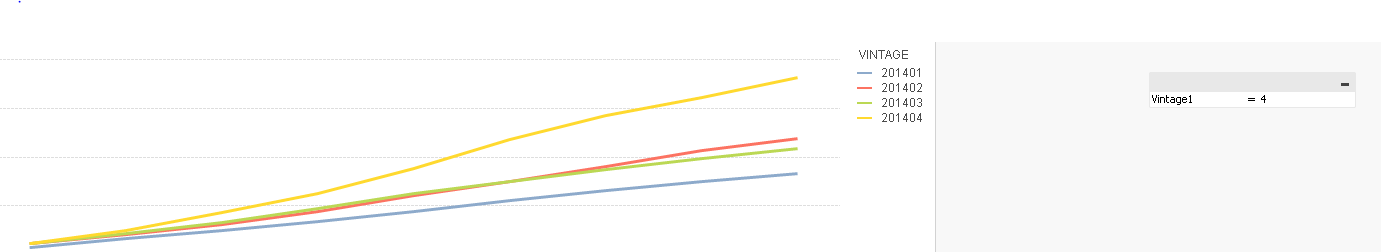
This is with Dimension Limit :First
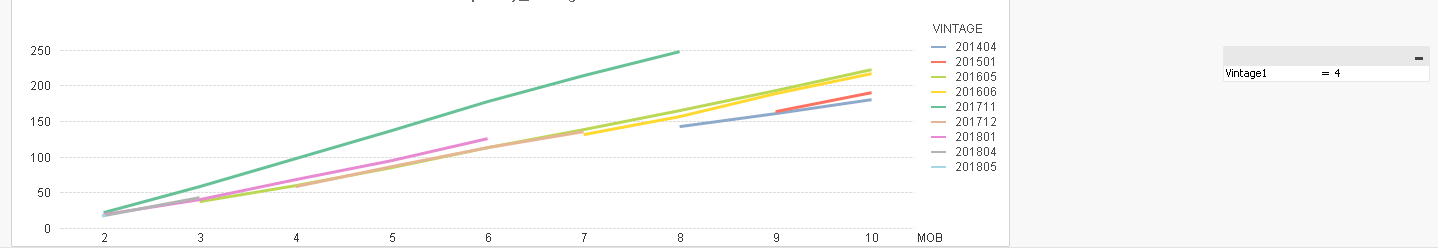
Same code Dimension Limit: Largest
- Mark as New
- Bookmark
- Subscribe
- Mute
- Subscribe to RSS Feed
- Permalink
- Report Inappropriate Content
Instead of using the option of limiting the dimension, use set analysis for your dimension.
Don't know what your expression is like, but you could do something like bellow, assuming your variable is named "VintageL".
sum({<[MOB]={">=$(=max([MOB])-$(VintageL)"}>}Value)
which will be evaluated to:
sum({<[MOB]={">=6"}>}Value)
that will sum up the values for the dimension values that are the max (in your screenshot 6 to 10)
You can also change the greater than to lesser than, depending on the logic you want.
- Mark as New
- Bookmark
- Subscribe
- Mute
- Subscribe to RSS Feed
- Permalink
- Report Inappropriate Content
Hi Felip,
I only want to limit Vintage.
The result I need is if I want to showcase 5 vintages against all MOBS , it should display 5 vintages only .Same for any other number.
Right now when i do First 5 it shows correct result i.e. 201401,201402,201403 ...
But when I do Largest 5 ,the result is random.
I need to showcase latest i.e.201801, 201802.... whatever is latest in the data
- Mark as New
- Bookmark
- Subscribe
- Mute
- Subscribe to RSS Feed
- Permalink
- Report Inappropriate Content
When you get the largest, it wont show the largest based on the dimension, it will get the greatest result from your expression and display that, giving you the "random" results you talk about.
How are your data and expresisons defined?
- Mark as New
- Bookmark
- Subscribe
- Mute
- Subscribe to RSS Feed
- Permalink
- Report Inappropriate Content
Add to your master calendar:
Autonumber(YearMonth) as _yearmonth_id
(sort your calendar on date asc)
Then create an expression: sum({<_yearmonth_id => {"$(=max(_yearmonth_id)-5)" >}VINTAGE)
This expression always calculates over the latest 5 periodes compared to selections.
- Mark as New
- Bookmark
- Subscribe
- Mute
- Subscribe to RSS Feed
- Permalink
- Report Inappropriate Content
I have vintage ranging from 201401 to 201807(last month)
MOB 1 to 24(which i need to display)
expression =sum(XYZ)
so here I am using two dimensions MOB and VINTAGE to depict sum of XYZ
The user gets to select the range of vintage he wants to see across these MOBs.
But the vintage should start from the latest always i.e 201807
- Mark as New
- Bookmark
- Subscribe
- Mute
- Subscribe to RSS Feed
- Permalink
- Report Inappropriate Content
Hi,
For this way is set expression you have to declare max year in set expression.
sum({<[MOB]={">=6"},Year={max(Year)}>}Value)
Thanks
- Mark as New
- Bookmark
- Subscribe
- Mute
- Subscribe to RSS Feed
- Permalink
- Report Inappropriate Content
Hi Michiel,
Thanks for the replu.
I created this code(sorry I am pretty new in QLikview)
masterCalendar:
LOAD
AutoNumber(Vintage) as year_month_id,
year_month_id as [Vintage];
But on reloading it doent create this table
- Mark as New
- Bookmark
- Subscribe
- Mute
- Subscribe to RSS Feed
- Permalink
- Report Inappropriate Content
I think you do not have a calendar in your script.
Please search the forum and blog post about master calendars. A vital component for your application.
For instance: The Master Calendar