Unlock a world of possibilities! Login now and discover the exclusive benefits awaiting you.
- Qlik Community
- :
- All Forums
- :
- QlikView App Dev
- :
- How to make dates as columns?
- Subscribe to RSS Feed
- Mark Topic as New
- Mark Topic as Read
- Float this Topic for Current User
- Bookmark
- Subscribe
- Mute
- Printer Friendly Page
- Mark as New
- Bookmark
- Subscribe
- Mute
- Subscribe to RSS Feed
- Permalink
- Report Inappropriate Content
How to make dates as columns?
Hi community.
I have been trying to figure out how to create this in Qlikview:
| TOTAL RESPONSE | ||||||
| Jan-17 | Feb-17 | Mar-17 | Apr-17 | May-17 | Jun-17 | |
| Analyst 1 | 31.58% | 41.18% | 75.00% | 50.00% | 70.59% | 75.00% |
| Analyst 2 | 100.00% | 100.00% | 100.00% | 70.00% | 68.75% | 76.92% |
| Analyst 3 | 58.82% | 92.31% | 90.00% | 54.17% | 53.57% | 60.00% |
| Analyst 4 | 50.00% | 66.67% | 73.68% | 68.75% | 53.33% | 75.00% |
| Analyst 5 | 80.00% | 40.00% | 68.97% | 52.38% | 69.57% | 57.69% |
I'm not having any luck in making the dates as columns. I'm sorry of this is too basic, but I would appreciate some guidance!
- « Previous Replies
-
- 1
- 2
- Next Replies »
Accepted Solutions
- Mark as New
- Bookmark
- Subscribe
- Mute
- Subscribe to RSS Feed
- Permalink
- Report Inappropriate Content
John
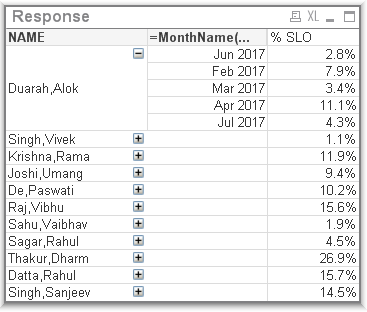
To get the months as columns click and hold one of the month names and drag it above the % SLO column
Regards
Adrian
- Mark as New
- Bookmark
- Subscribe
- Mute
- Subscribe to RSS Feed
- Permalink
- Report Inappropriate Content
Check this link out
- Mark as New
- Bookmark
- Subscribe
- Mute
- Subscribe to RSS Feed
- Permalink
- Report Inappropriate Content
Sunny,
Interesting, but a tad over my head! I'm still not sure of what to do after reading through it.
- Mark as New
- Bookmark
- Subscribe
- Mute
- Subscribe to RSS Feed
- Permalink
- Report Inappropriate Content
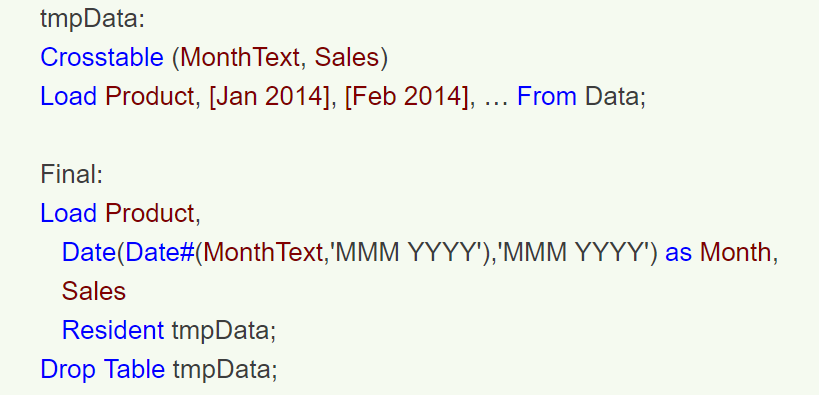
The CrossTable Load syntax will help you convert your Month Year fields into a single Month field. if you can share you sample as an Excel file I can show how it can be done for you... but in general this is the idea
Table:
CrossTable (MonthYear, Data)
LOAD *
FROM .....;
and the second part of the script is used to help interpret the MonthYear field as a date field
- Mark as New
- Bookmark
- Subscribe
- Mute
- Subscribe to RSS Feed
- Permalink
- Report Inappropriate Content
thanks, I've attached the file. As you will see, the table data is a calculation. I assume I would need to do that in my script, too?
Appreciate your help!
- Mark as New
- Bookmark
- Subscribe
- Mute
- Subscribe to RSS Feed
- Permalink
- Report Inappropriate Content
John - I am confused... is the above is what you want to see as an output in a QlikView chart?? I was under the impression that you wanted to show the above table and convert it into QlikView data. I am working on it...
- Mark as New
- Bookmark
- Subscribe
- Mute
- Subscribe to RSS Feed
- Permalink
- Report Inappropriate Content
Ha, sorry about that!
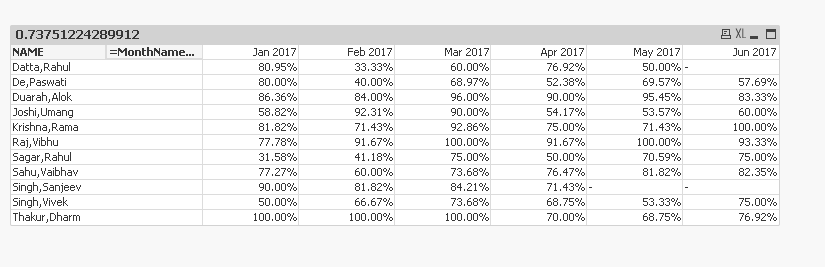
My goal is to display the above chart in my Qlikview file. I want to see the analyst and their performance for each given month as the column.
- Mark as New
- Bookmark
- Subscribe
- Mute
- Subscribe to RSS Feed
- Permalink
- Report Inappropriate Content
Here check the attached
- Mark as New
- Bookmark
- Subscribe
- Mute
- Subscribe to RSS Feed
- Permalink
- Report Inappropriate Content
Sunny - I've replicated your example in my qvw and it is not giving me the expected results; no months to columns and the %'s are not right (much too low). Any idea on what is going on? I appreciate your time in helping me!
- Mark as New
- Bookmark
- Subscribe
- Mute
- Subscribe to RSS Feed
- Permalink
- Report Inappropriate Content
John,
Your Excel Calculation,
IF(COUNTIFS(data!$A:$A,$B4,data!$B:$B,C$3)>0,(COUNTIFS(data!$A:$A,$B4,data!$G:$G,"LIVE",data!$K:$K,"< 10"
,data!$B:$B,C$3)+COUNTIFS(data!$A:$A,$B4,data!$G:$G,"ELEC",data!$K:$K,"< 60",data!$B:$B,C$3))/(COUNTIFS(data!$A:$A,$B4,data!$B:$B,C$3))," ")
This calculation based on 3 columns (NAME, SOURCE and RESPTIME)
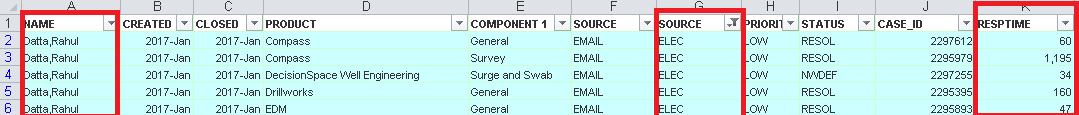
Based on your excel..
(Count(LIVE < 10)
+
Count(ELEC < 60)
/
Count(NAME)
PFA,
- « Previous Replies
-
- 1
- 2
- Next Replies »