Unlock a world of possibilities! Login now and discover the exclusive benefits awaiting you.
- Qlik Community
- :
- All Forums
- :
- QlikView App Dev
- :
- How to not show empty fields?
- Subscribe to RSS Feed
- Mark Topic as New
- Mark Topic as Read
- Float this Topic for Current User
- Bookmark
- Subscribe
- Mute
- Printer Friendly Page
- Mark as New
- Bookmark
- Subscribe
- Mute
- Subscribe to RSS Feed
- Permalink
- Report Inappropriate Content
How to not show empty fields?
Dear all,
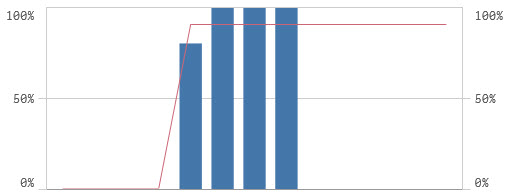
See below graph. For the first few instances there is a 0 value. I would like the data to start at when there is a value so I don't have the diagonal red line (and the horizontal red line prior to that at the bottom of the graph). How can this be accomplished? I tried to find it in older topics but I could not find it.
There is an option to 'show as gaps' but that does not seem to do anything.
Hopefully I have given sufficient information, if not please ask !
Many thanks and best regards.
Accepted Solutions
- Mark as New
- Bookmark
- Subscribe
- Mute
- Subscribe to RSS Feed
- Permalink
- Report Inappropriate Content
- Mark as New
- Bookmark
- Subscribe
- Mute
- Subscribe to RSS Feed
- Permalink
- Report Inappropriate Content
Can you check if you have zero value suppressed on the presentation tab - 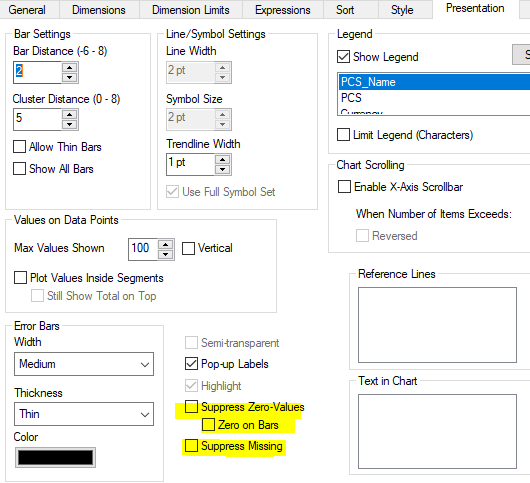
- Mark as New
- Bookmark
- Subscribe
- Mute
- Subscribe to RSS Feed
- Permalink
- Report Inappropriate Content
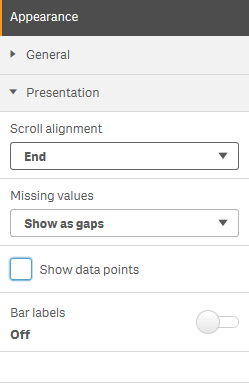
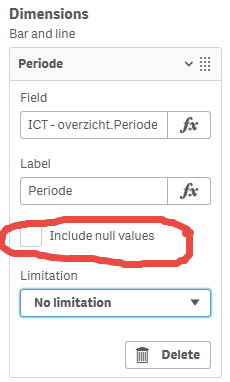
I am using the Qlik cloud version, so I don't think I have this screen. Here are the options I can see:
- Mark as New
- Bookmark
- Subscribe
- Mute
- Subscribe to RSS Feed
- Permalink
- Report Inappropriate Content
Hi,
Check suppress when value is null in dimensions tab.
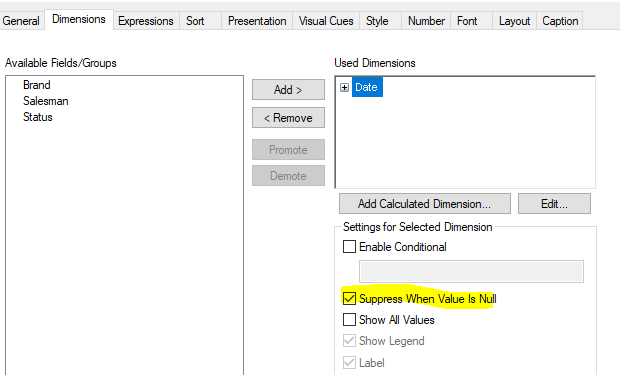
Thanks,
Pooja
- Mark as New
- Bookmark
- Subscribe
- Mute
- Subscribe to RSS Feed
- Permalink
- Report Inappropriate Content
Hi Pooja,
It is, as far as I can see.
- Mark as New
- Bookmark
- Subscribe
- Mute
- Subscribe to RSS Feed
- Permalink
- Report Inappropriate Content
Do work around using expression to restrict the Null values?
- Mark as New
- Bookmark
- Subscribe
- Mute
- Subscribe to RSS Feed
- Permalink
- Report Inappropriate Content
you can use below expression as well
if(sum(expn)>0,sum(expn))
- Mark as New
- Bookmark
- Subscribe
- Mute
- Subscribe to RSS Feed
- Permalink
- Report Inappropriate Content
Thanks a lot, that worked perfectly!
Thanks to all others as well for replying!