Unlock a world of possibilities! Login now and discover the exclusive benefits awaiting you.
- Qlik Community
- :
- All Forums
- :
- QlikView App Dev
- :
- Re: How to plot line chart with two different dime...
- Subscribe to RSS Feed
- Mark Topic as New
- Mark Topic as Read
- Float this Topic for Current User
- Bookmark
- Subscribe
- Mute
- Printer Friendly Page
- Mark as New
- Bookmark
- Subscribe
- Mute
- Subscribe to RSS Feed
- Permalink
- Report Inappropriate Content
How to plot line chart with two different dimensions and single expression
Hi everyone,
I have a table below as shown.
| ID# | Section | Point | RPM | m_dot | Power |
| 1 | 1 | 1 | 5620 | 22020 | 1300 |
| 1 | 1 | 2 | 5620 | 30179 | 1915 |
| 1 | 1 | 3 | 5620 | 30795 | 1915 |
| 1 | 1 | 4 | 5620 | 38270 | 2490 |
| 1 | 1 | 5 | 5620 | 39154 | 2490 |
| 1 | 1 | 6 | 5620 | 46554 | 3000 |
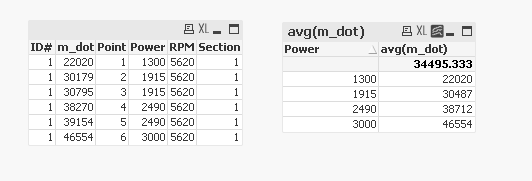
I want to plot the above table in Line chart showing Power on X-axis and m_dot on Y-axis. When I plot the graph its taking the Power 1915 which has m_dot of 30179 & 30795 values. But its plotting single point on 1915 with power and m_dot to be average of both values as 30487. Similar case with 2490 as Power.
I simply want all Power plots and m_dot to be plotted on line chart.
Can anyone help me with this !!
Thanks !!
Rajender
- « Previous Replies
-
- 1
- 2
- Next Replies »
- Mark as New
- Bookmark
- Subscribe
- Mute
- Subscribe to RSS Feed
- Permalink
- Report Inappropriate Content
Hi Rajender,
May be
Dimension: [Power]
Expression: Avg(m_dot)
Andrey
- Mark as New
- Bookmark
- Subscribe
- Mute
- Subscribe to RSS Feed
- Permalink
- Report Inappropriate Content
Hi Andrey,
Thanks for your reply.
Its not working in my case. Can you share me an app with the line chart.
- Mark as New
- Bookmark
- Subscribe
- Mute
- Subscribe to RSS Feed
- Permalink
- Report Inappropriate Content
See attached App as mentioned by Andrey to use Avg(m_dot)
- Mark as New
- Bookmark
- Subscribe
- Mute
- Subscribe to RSS Feed
- Permalink
- Report Inappropriate Content
Thanks for your reply Chai Peri.
The app which u shared is fine. But When you turn the line chart to straight table which is on right side it shows 1915 as average of both values of 1915. But I need both values of 1915 and 2490 to be plotted on line chart.
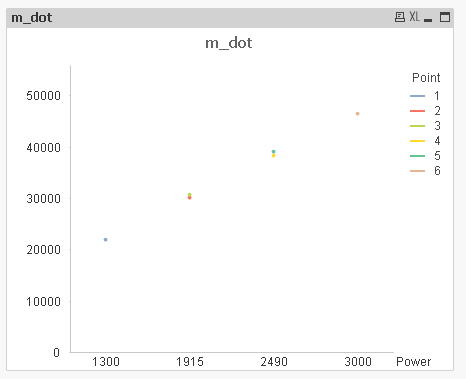
If I take Point as second dimension in line chart it shows the graph i wanted but it shows only dots but i need that to be in dots joining the line.
- Mark as New
- Bookmark
- Subscribe
- Mute
- Subscribe to RSS Feed
- Permalink
- Report Inappropriate Content
Hi
Please find attached app. Please let us know if you are looking something else
Hope it helps!!
- Mark as New
- Bookmark
- Subscribe
- Mute
- Subscribe to RSS Feed
- Permalink
- Report Inappropriate Content
Thanks for your reply Anil kumar.
App which you shared also shows only 4 points of power. but where I have 6 values under Power column.
- Mark as New
- Bookmark
- Subscribe
- Mute
- Subscribe to RSS Feed
- Permalink
- Report Inappropriate Content
Even adding point as secondary dimension How can you expect to make line chart with two dots for one of the dimension values .Am I missing something?
- Mark as New
- Bookmark
- Subscribe
- Mute
- Subscribe to RSS Feed
- Permalink
- Report Inappropriate Content
Hi Anil & Chai Peri
I have added point as second dimension but I am getting the as dots in line chart.
But i want to join all those points and show as line. ! !
- Mark as New
- Bookmark
- Subscribe
- Mute
- Subscribe to RSS Feed
- Permalink
- Report Inappropriate Content
No thats what i am confused. I cant make a line chart using those dimensions?
- « Previous Replies
-
- 1
- 2
- Next Replies »