Unlock a world of possibilities! Login now and discover the exclusive benefits awaiting you.
- Qlik Community
- :
- All Forums
- :
- QlikView App Dev
- :
- How to show charts in report even it is hidden in ...
- Subscribe to RSS Feed
- Mark Topic as New
- Mark Topic as Read
- Float this Topic for Current User
- Bookmark
- Subscribe
- Mute
- Printer Friendly Page
- Mark as New
- Bookmark
- Subscribe
- Mute
- Subscribe to RSS Feed
- Permalink
- Report Inappropriate Content
How to show charts in report even it is hidden in a container
Hi All,
I have three charts that is stored in the same container and I need to show all in the same report at the same time.
Do you know how to do it?
# Top 10 Routes
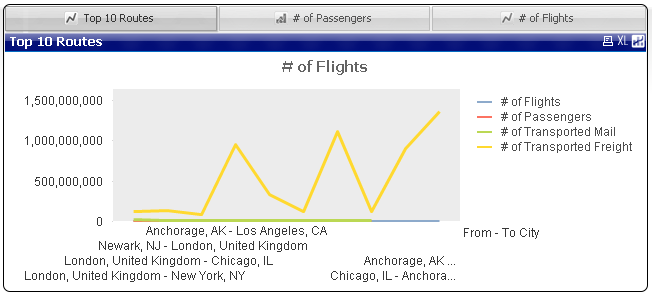
# of Passengers

# Of Flights

I want them to be displayed in the report at the same time. Can anyone share me some idea?
Attached is the QVW application
User ID: Admin Password: admin123
Thanks in advance!
- « Previous Replies
-
- 1
- 2
- Next Replies »
- Mark as New
- Bookmark
- Subscribe
- Mute
- Subscribe to RSS Feed
- Permalink
- Report Inappropriate Content
Properties--->Presentation--> Container Type-->Change to Grid
- Mark as New
- Bookmark
- Subscribe
- Mute
- Subscribe to RSS Feed
- Permalink
- Report Inappropriate Content
Why do you want to use a container? If you want to show the charts at the same time, why not simply move them from the container to the sheet and delete the container?
talk is cheap, supply exceeds demand
- Mark as New
- Bookmark
- Subscribe
- Mute
- Subscribe to RSS Feed
- Permalink
- Report Inappropriate Content
Hi Gysbert and Robert,
It is because of limitation on the screen size, I cannot show all charts at the same time. However, when it come to a print out, I want all of them to be shown on the same pieces of paper.
Just before I respond to this blog, I cloned the three charts into a hidden sheet and use that the charts from the hidden sheet instead as a work around solution.
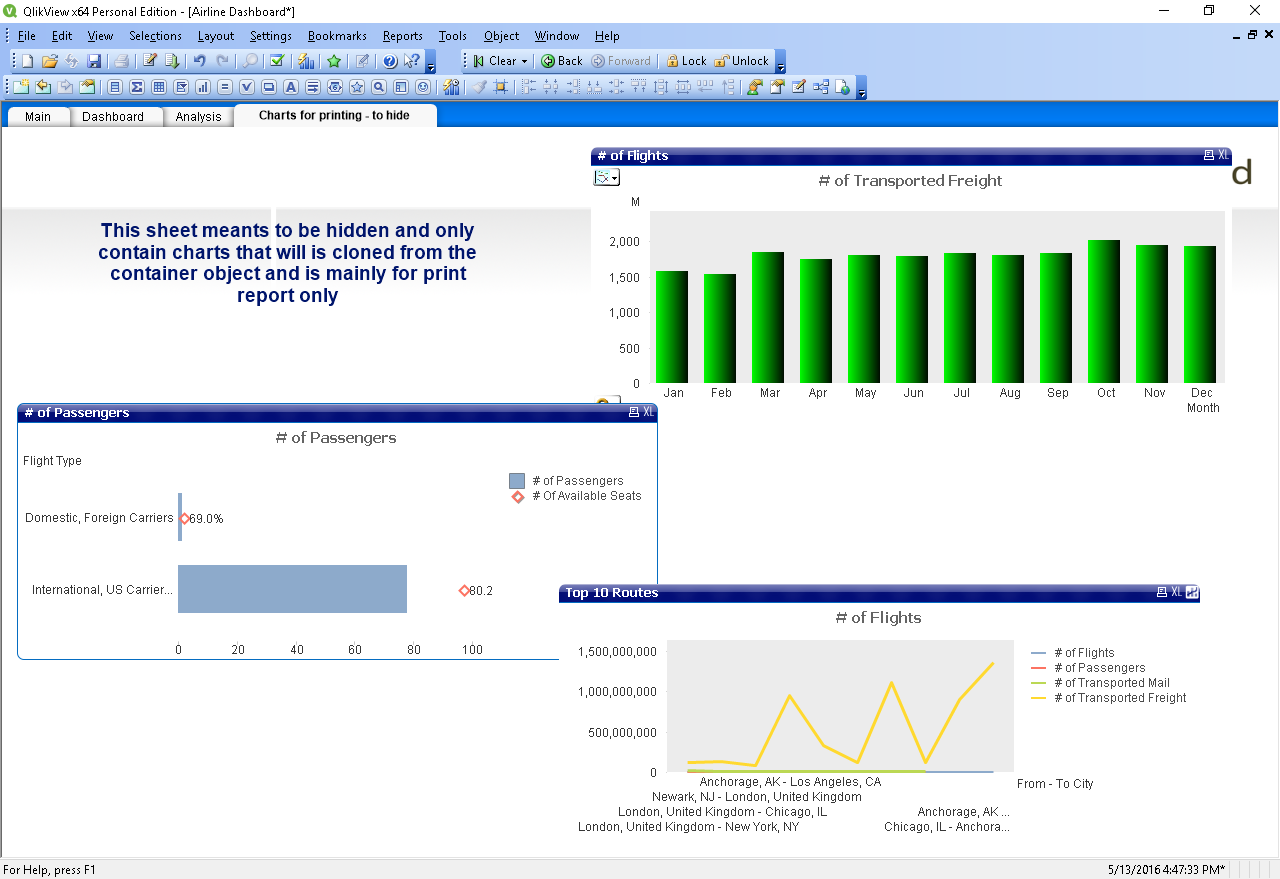
However, it appears very ignoring as this means when I need to change properties for the chart in the container I will also have to change properties for chart in the hidden sheet. So I don't know if there is any better way to do it.
Elim.
- Mark as New
- Bookmark
- Subscribe
- Mute
- Subscribe to RSS Feed
- Permalink
- Report Inappropriate Content
When I say hide the sheet, I simply put an always false criteria (e.g. 1 =2) into the show condition of the sheet new sheet object.
- Mark as New
- Bookmark
- Subscribe
- Mute
- Subscribe to RSS Feed
- Permalink
- Report Inappropriate Content
Unfortunately your workaround is necessary for the standard report functionality in QlikView. For changing chart properties only once, have a look at linked objects:
- Mark as New
- Bookmark
- Subscribe
- Mute
- Subscribe to RSS Feed
- Permalink
- Report Inappropriate Content
Hi Piet,
I tried link object before, but it appears doesn't work for me. If the inactive in the container, the report failed to populate the chart. I don't know is it because both charts shared the same status.
Elim.
- Mark as New
- Bookmark
- Subscribe
- Mute
- Subscribe to RSS Feed
- Permalink
- Report Inappropriate Content
Hi Elim,
Yes, that's probably it. In that case you will need to duplicate the objects and unfortunately do changes twice...
Or maybe as another work around, instead of the container use button\text objects with an action to activate the relevant object. Overlay the objects (same size) in the 'normal' layering mode, the activation trigger will pull the chart on the foreground hiding the other objects. At least that worked for me on desktop, have not tried that online.
- Mark as New
- Bookmark
- Subscribe
- Mute
- Subscribe to RSS Feed
- Permalink
- Report Inappropriate Content
Hi Elim,
Try like this:
Select 1st chart in the container, then open the report --> drag and drop the chart--> then close the report.
Select the 2nd chart from the container --> open the report again and now drag and drop the second chart in to the report.
Hope this works.
Br,
KC
KC
- Mark as New
- Bookmark
- Subscribe
- Mute
- Subscribe to RSS Feed
- Permalink
- Report Inappropriate Content
Linked Objects should work in this case. Just make sure you drag the cloned object from the reports sheet into the report, not the container copy.
-Rob
- « Previous Replies
-
- 1
- 2
- Next Replies »