Unlock a world of possibilities! Login now and discover the exclusive benefits awaiting you.
- Qlik Community
- :
- All Forums
- :
- QlikView App Dev
- :
- How to show multiple fields in horizontal axis
- Subscribe to RSS Feed
- Mark Topic as New
- Mark Topic as Read
- Float this Topic for Current User
- Bookmark
- Subscribe
- Mute
- Printer Friendly Page
- Mark as New
- Bookmark
- Subscribe
- Mute
- Subscribe to RSS Feed
- Permalink
- Report Inappropriate Content
How to show multiple fields in horizontal axis
Hello
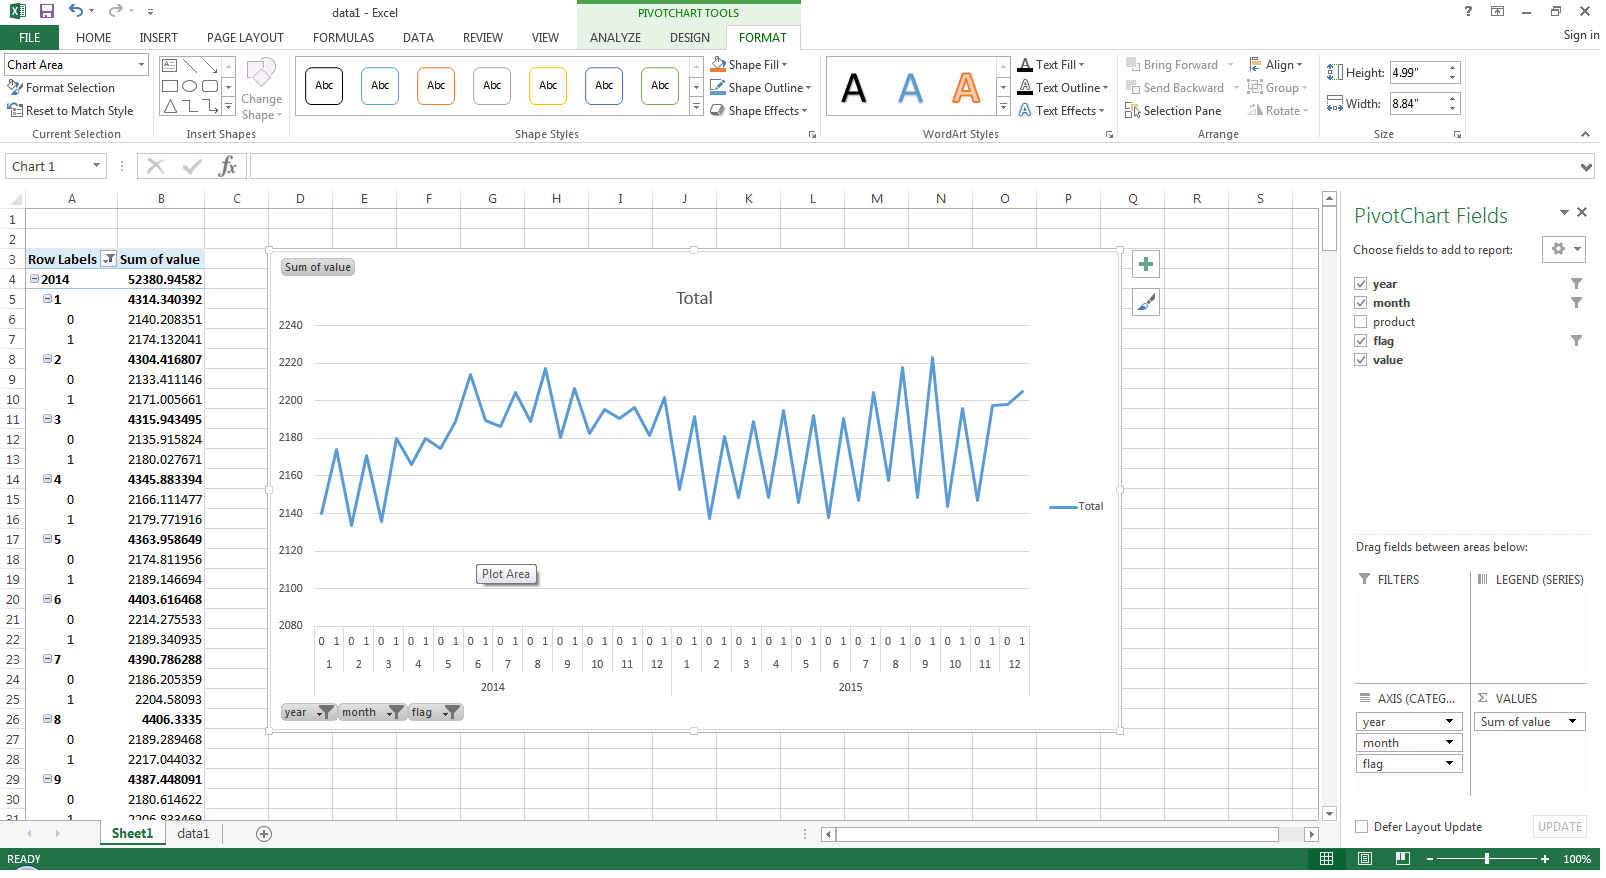
I am new to QlikView; I want to display more than one field on x axis in a chart. Below is an example of what I'm seeking in excel pivot chart. As seen in x axis, there are 3 different fields nested showing in the chart.
Thanks!
- Mark as New
- Bookmark
- Subscribe
- Mute
- Subscribe to RSS Feed
- Permalink
- Report Inappropriate Content
Try with only one calculated dimension: Dim1&chr(10)&Dim2&chr(10)&Dim3
Chr(10) is a return
Kind regards,
- Mark as New
- Bookmark
- Subscribe
- Mute
- Subscribe to RSS Feed
- Permalink
- Report Inappropriate Content
Hi mate,
Can you please send a sample of your data values so we can make you a solution for you?
Regards,
MB
- Mark as New
- Bookmark
- Subscribe
- Mute
- Subscribe to RSS Feed
- Permalink
- Report Inappropriate Content
I tried this but it does not work.
- Mark as New
- Bookmark
- Subscribe
- Mute
- Subscribe to RSS Feed
- Permalink
- Report Inappropriate Content
I attach a sample data. In Excel it's pretty straight forward to show nested fields in x axis as I displayed in the original post. I could not get this done in QV though.
Thanks!
IS