Unlock a world of possibilities! Login now and discover the exclusive benefits awaiting you.
- Qlik Community
- :
- All Forums
- :
- QlikView App Dev
- :
- How to show no of times student presence in pie ch...
- Subscribe to RSS Feed
- Mark Topic as New
- Mark Topic as Read
- Float this Topic for Current User
- Bookmark
- Subscribe
- Mute
- Printer Friendly Page
- Mark as New
- Bookmark
- Subscribe
- Mute
- Subscribe to RSS Feed
- Permalink
- Report Inappropriate Content
How to show no of times student presence in pie chart?
Hi,
I have chart in qvw with StudentID, StaffID, Department, [Exam Date], [Record Date],[No of times Student presence].
the values in column [No of times Student presence] are as shown below
4,9,8,2,1,1,1,1,1,3,3,3,3,5,5,5,5,7,7,7,10,0,34,90,100,21,24
the expression used under [No of times Student presence] is Count(StudentID)
The sample data in chart is as below
| StudentID | StaffID | Department | Exam Date | Record Date | No of times student Presence |
| 0 | 0 | Physics | 27/02/2011 | 04/03/2011 | 24 |
| 0 | 12 | Physics | 27/02/2011 | 04/03/2011 | 52 |
| 0 | 12 | Accounts | 02/03/2015 | 03/03/2015 | 5 |
| 890097 | 12 | Chemistry | 27/02/2015 | 27/02/2015 | 1 |
| 553536352 | 12 | Physics | 02/03/2015 | 02/03/2015 | 1 |
| 932534376 | 12 | Chemistry | 03/03/2015 | 03/03/2015 | 1 |
| 152464986 | 12 | Chemistry | 03/03/2015 | 03/03/2015 | 1 |
| 170664772 | 0 | Chemistry | 02/03/2015 | 04/03/2015 | 4 |
| 182754332 | 0 | Maths | 03/03/2015 | 04/03/2015 | 2 |
| 182754332 | 12 | Chemistry | 02/03/2015 | 04/03/2015 | 2 |
| 904856484 | 0 | Maths | 02/03/2015 | 03/03/2015 | 3 |
| 489547704 | 0 | Chemistry | 02/03/2010 | 03/03/2010 | 3 |
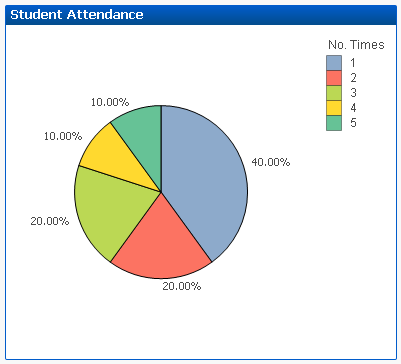
I need to show a pie chart to show the number of times student presence be represented in a graph for example 300 Students, of which 25 are presence to once, 25 are presence to twice and 100 are presence to three times
Please can anyone help me in this.
Thanks.
- Tags:
- new_to_qlikview
- « Previous Replies
-
- 1
- 2
- Next Replies »
- Mark as New
- Bookmark
- Subscribe
- Mute
- Subscribe to RSS Feed
- Permalink
- Report Inappropriate Content
Hi,
Have your tried using a calculated dimension like:
=aggr(sum([No of times student Presence]), StudentID)
with the expression
count(StudentID)
br
Paul
- Mark as New
- Bookmark
- Subscribe
- Mute
- Subscribe to RSS Feed
- Permalink
- Report Inappropriate Content
See attached example.
talk is cheap, supply exceeds demand
- Mark as New
- Bookmark
- Subscribe
- Mute
- Subscribe to RSS Feed
- Permalink
- Report Inappropriate Content
Thanks. the data which I added in my original post is just 11 rows data. But I have millions of data in excel file.
how I need to use Count(StudentID) to show as pie chart
- Mark as New
- Bookmark
- Subscribe
- Mute
- Subscribe to RSS Feed
- Permalink
- Report Inappropriate Content
any suggestions please?
- Mark as New
- Bookmark
- Subscribe
- Mute
- Subscribe to RSS Feed
- Permalink
- Report Inappropriate Content
If you want to show the pie chart as percentages, just click the 'relative' checkbox in the expressions tab.
- Mark as New
- Bookmark
- Subscribe
- Mute
- Subscribe to RSS Feed
- Permalink
- Report Inappropriate Content
Thanks. I tried it. Not working. Please any help.
- Mark as New
- Bookmark
- Subscribe
- Mute
- Subscribe to RSS Feed
- Permalink
- Report Inappropriate Content
Thanks. Tried this. not showing exact result.
- Mark as New
- Bookmark
- Subscribe
- Mute
- Subscribe to RSS Feed
- Permalink
- Report Inappropriate Content
Very similar to Gysbert's example above ....
Main difference being using a percentage scale.
Hopefully this helps
- Mark as New
- Bookmark
- Subscribe
- Mute
- Subscribe to RSS Feed
- Permalink
- Report Inappropriate Content
Thanks. you added dimension student presence.
But this student presence have values which is getting from below expression.
Count(StudentID)
so, my requirement is dimension and expression both are same.
is it possible to use expression count(StudentID) for both Dimension and Expression.
Please help me. when I am trying I am not getting exact solution.
- « Previous Replies
-
- 1
- 2
- Next Replies »