Unlock a world of possibilities! Login now and discover the exclusive benefits awaiting you.
- Qlik Community
- :
- All Forums
- :
- QlikView App Dev
- :
- Re: How to show only the Total in a Bar Chart?
- Subscribe to RSS Feed
- Mark Topic as New
- Mark Topic as Read
- Float this Topic for Current User
- Bookmark
- Subscribe
- Mute
- Printer Friendly Page
- Mark as New
- Bookmark
- Subscribe
- Mute
- Subscribe to RSS Feed
- Permalink
- Report Inappropriate Content
How to show only the Total in a Bar Chart?
Hello everyone,
I'm new in QlikView and would like to display only the total value of the sum of the values of the same bar in a stacked bar chart.
When I select "Show Total", the graph shows the total value above all other values as shown in the image below:
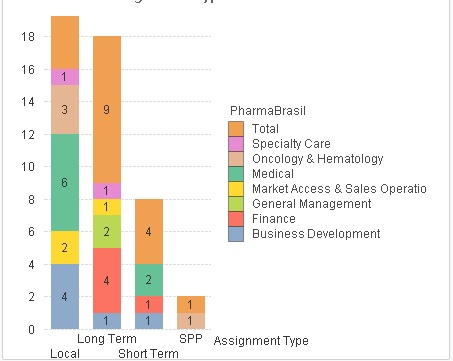
I just want to ignore the other values and show just the total.
Regards,
Rodrigo
- Tags:
- new_to_qlikview
- « Previous Replies
-
- 1
- 2
- Next Replies »
- Mark as New
- Bookmark
- Subscribe
- Mute
- Subscribe to RSS Feed
- Permalink
- Report Inappropriate Content
Hi,
Create one expression( Mostly the same as the one which you have). Remove the Bar option ans select the "Values on Data Point" Option.
Regards,
Kaushik Solanki
- Mark as New
- Bookmark
- Subscribe
- Mute
- Subscribe to RSS Feed
- Permalink
- Report Inappropriate Content
As previously stated, another expression is needed to represent the total. If the total expression you have now is the true total, you can use that one but do not set as bar - if you do, you are then adding a total bar on top of all of the stacked bars that make up the total. Select Show values on datapoint for the total expression (with no bar)
- Mark as New
- Bookmark
- Subscribe
- Mute
- Subscribe to RSS Feed
- Permalink
- Report Inappropriate Content
This should work as is. if you remove the "Plot Values Inside Segments" option on the Presentation tab.
-Rob
- Mark as New
- Bookmark
- Subscribe
- Mute
- Subscribe to RSS Feed
- Permalink
- Report Inappropriate Content
Thanks guys for your tips... Now i have only the total number at the top of all the stacked bars, as shown in the image below:
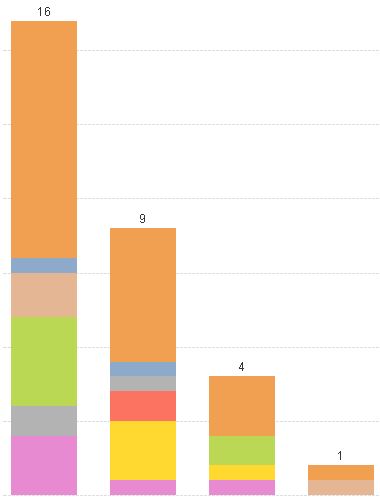
But i still see the others bars right below the total (orange).
I need to remove all, not only the values, and display only the orange, which is the total.
Thanks again.
Regards,
Rodrigo
- Mark as New
- Bookmark
- Subscribe
- Mute
- Subscribe to RSS Feed
- Permalink
- Report Inappropriate Content
I you currently have 4 expressions, just remove the dimension.
- Mark as New
- Bookmark
- Subscribe
- Mute
- Subscribe to RSS Feed
- Permalink
- Report Inappropriate Content
If you do not, remove dimension PharmaBrasil
- Mark as New
- Bookmark
- Subscribe
- Mute
- Subscribe to RSS Feed
- Permalink
- Report Inappropriate Content
Actually i used the same expression to the 4 bars... but i have 3 dimensions in the chart, that i cannot remove...
- Mark as New
- Bookmark
- Subscribe
- Mute
- Subscribe to RSS Feed
- Permalink
- Report Inappropriate Content
it sounds like you want a bar chart that just shows total (a bar by assignment type) and no type of visual breakout by PharmaBrasil?
I would recommend you remove the orange bar but leave the total and show the other below - this will give you a visual view of the makeup of the total, with the total number, but doing what you want is possible - it would involve the total expression by assignment type
can you provide the qvw?
- Mark as New
- Bookmark
- Subscribe
- Mute
- Subscribe to RSS Feed
- Permalink
- Report Inappropriate Content
1 dimension with 4 expressions in style we select stack with values on data points...it shows like as shown in the image...now we right click on the chart presentation tab uncheck the plotedinside the segments..it shows total values in outside the each bar
- « Previous Replies
-
- 1
- 2
- Next Replies »