Unlock a world of possibilities! Login now and discover the exclusive benefits awaiting you.
- Qlik Community
- :
- All Forums
- :
- QlikView App Dev
- :
- How to show three events in one chart?
- Subscribe to RSS Feed
- Mark Topic as New
- Mark Topic as Read
- Float this Topic for Current User
- Bookmark
- Subscribe
- Mute
- Printer Friendly Page
- Mark as New
- Bookmark
- Subscribe
- Mute
- Subscribe to RSS Feed
- Permalink
- Report Inappropriate Content
How to show three events in one chart?
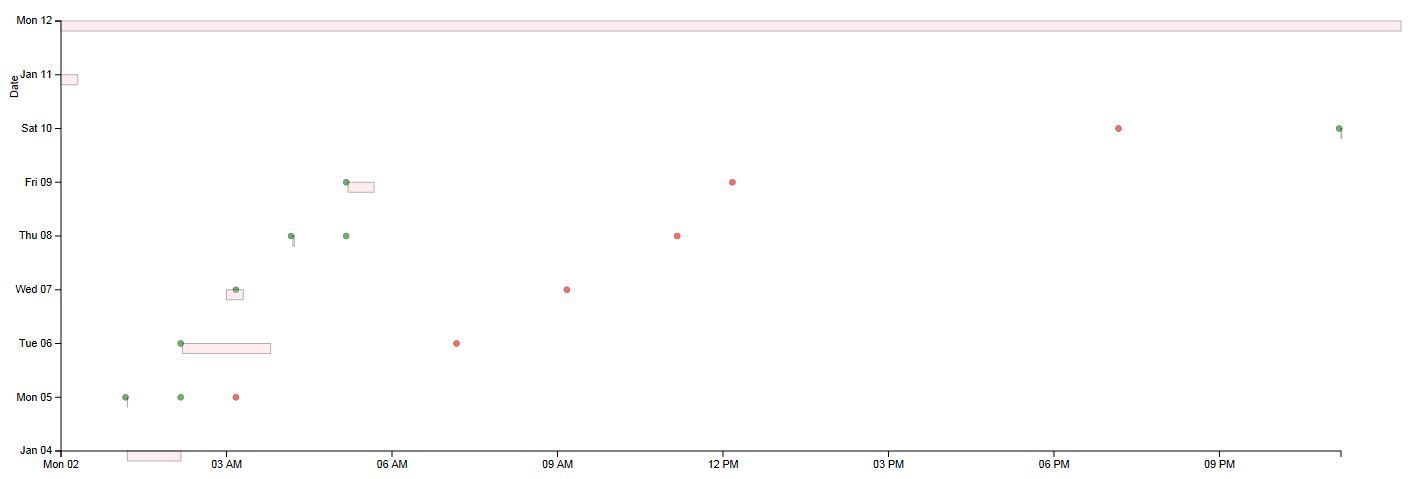
I want to draw a chart as mentioned in the image.
I have three tables. Each table is used to register different events.
Table 1:
Date, Time, Duration
Table 2:
Date, Time
Table 3:
Date, Time
I want show all the events in one single chart.
It is possible in D3.js.
Is it possible in Qlikview?
If yes, Please explain how.
I am new to Qlikview.
Please help.
- Mark as New
- Bookmark
- Subscribe
- Mute
- Subscribe to RSS Feed
- Permalink
- Report Inappropriate Content
Hi Prakash
Do you know that you can actually use D3.js library to create extension objects in QlikView?
So If you know how to use D3 and no that what you are looking for is doable with D3.js, why don't you try creating an extension object for QlikView??
- Mark as New
- Bookmark
- Subscribe
- Mute
- Subscribe to RSS Feed
- Permalink
- Report Inappropriate Content
Dear Agis,
Thanks for you reply.
Yes. I know. I am aleady doing that at this moment.
I just wanted to know other possibilities to reduce complexity.
Regards,
Prakash
- Mark as New
- Bookmark
- Subscribe
- Mute
- Subscribe to RSS Feed
- Permalink
- Report Inappropriate Content
yes u can,u can map ur tables by using date&time as key and show ur events in y axis and date in x -axis.
- Mark as New
- Bookmark
- Subscribe
- Mute
- Subscribe to RSS Feed
- Permalink
- Report Inappropriate Content
By this way, I can show only one set of data(x and y axis) in chart. I want to show 3 set of data.
Green dots show one set of events in the image(attached in question).
Red dots show another set of events.
Bar shows different set of events.