Unlock a world of possibilities! Login now and discover the exclusive benefits awaiting you.
- Qlik Community
- :
- All Forums
- :
- QlikView App Dev
- :
- How to sum based on values in different time perio...
- Subscribe to RSS Feed
- Mark Topic as New
- Mark Topic as Read
- Float this Topic for Current User
- Bookmark
- Subscribe
- Mute
- Printer Friendly Page
- Mark as New
- Bookmark
- Subscribe
- Mute
- Subscribe to RSS Feed
- Permalink
- Report Inappropriate Content
How to sum based on values in different time period
Dear people,
I wish to sum revenue for customer/article combinations in period 1 partially based on values in period 2 (or visa versa).
General background:
Recently within our company we started to use Qlik Sense as our BI tool with a dataset created by an external Qlik consultant. Tis upon me to recreate a few KPIs, originally calculated in Excel, in Qlik. Our department specializes in pricing strategy and requires various KPI's to monitor price changes on a customer / article level, but also to aggregate this on a customer level, or a country level, preferably dynamic as is a strength of Qlik.
Problem description:
Currently I am working on a KPI we call 'Price Increase', our management wishes to see this as a single number and allow subsequent drill downs or filters if required. We have discussed at length how we wish to calculate this and was agreed upon based on Excel calculations.
This KPI compares the price in two different time periods (P) and determines a delta.
Price is determined by dividing revenue by quantity for a period therefore requiring entries in both periods for quantity and revenue.
We wish to exclude rows with
- No revenue for either period
- No quantity for either period
Negative entries, e.g. a quantity of '-1' we would like to keep.
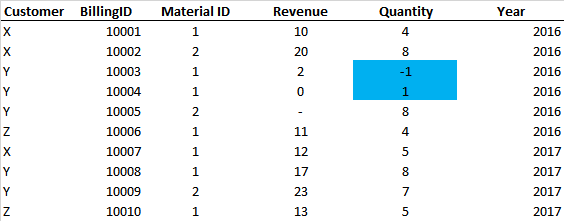
Our simplified dataset looks like this. As you can see there a entries with no data, for example the revenue for BillingID 10005. There are other columns, e.g. country but they are not relevant for this quesiton.
If we create a pivot of the data above we can easily highlight rows that should be excluded from this pricing analysis as there is only a price for a single period. A pivot allows us to see issues cropping up.
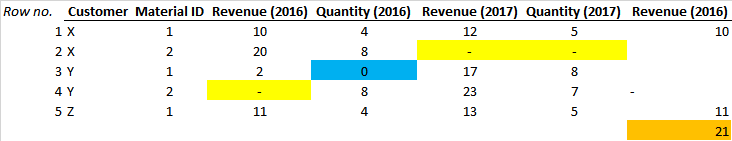
- Row 2 - no entry for 2017 for Customer X and Material 2 (visa versa can also occur, only data for 2017 and none for 2016)
- Row 3 - sum of quantiy is 0 (sum of total revenue can also be 0)
- Row 4 - No entry for revenue (e.g. free samples)
We wish to exclude these rows.
To further complicate matters the yellow fields can either be:
- Null values - there is no entry for that period within the dataset, for example Row 2 - Revenue (2017)
- The total is 0 for a period, e.g. two billing lines with +1 and -1 (row 3)
My question is how to calculate the orange cell within Qlik.
My solution direction so far has been failed set analysis as I am unsure how to do two conditions at the same time as I have to look at the corresponding Customer/Article combination in a different time period.
Can anybody shed some light on this conundrum.
Best,
N~
- Mark as New
- Bookmark
- Subscribe
- Mute
- Subscribe to RSS Feed
- Permalink
- Report Inappropriate Content
This seems to be for a chart, right? Why not check with an if statement to remove those rows which are have 0 or null
If(Len(Trim(Expression1)) = 0 or Expression1 = 0 (Len(Trim(Expression2)) = 0 or Expression2 = 0), Expression1)
If(Len(Trim(Expression1)) = 0 or Expression1 = 0 (Len(Trim(Expression2)) = 0 or Expression2 = 0), Expression2)