Unlock a world of possibilities! Login now and discover the exclusive benefits awaiting you.
- Qlik Community
- :
- All Forums
- :
- QlikView App Dev
- :
- Re: How to??/
- Subscribe to RSS Feed
- Mark Topic as New
- Mark Topic as Read
- Float this Topic for Current User
- Bookmark
- Subscribe
- Mute
- Printer Friendly Page
- Mark as New
- Bookmark
- Subscribe
- Mute
- Subscribe to RSS Feed
- Permalink
- Report Inappropriate Content
How to??/
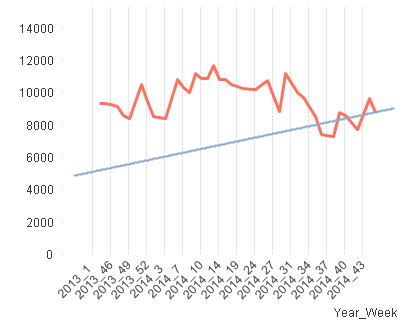
I am trying to create a trend line, but I am having some issue. I have a single measure, but need to have lines for some products, but not all products (the product lines will never change). I need to be able to filter the chart by customer (that part I have), but I also need to display a national trend for the same fitlers products.
Unfortunately for company policy, I can't post the qvw file 
Any guidance is appreciated!
- Tags:
- new_to_qlikview
- Mark as New
- Bookmark
- Subscribe
- Mute
- Subscribe to RSS Feed
- Permalink
- Report Inappropriate Content
You can obviously create sample data and post them here!
- Mark as New
- Bookmark
- Subscribe
- Mute
- Subscribe to RSS Feed
- Permalink
- Report Inappropriate Content
- Mark as New
- Bookmark
- Subscribe
- Mute
- Subscribe to RSS Feed
- Permalink
- Report Inappropriate Content
Have a look at qlikview sample file : Data Visualization
it has a good sample for trendlines.
- Mark as New
- Bookmark
- Subscribe
- Mute
- Subscribe to RSS Feed
- Permalink
- Report Inappropriate Content
Create individual expression for each product, that way you can have a trend line for each one. Hope this helps.
- Mark as New
- Bookmark
- Subscribe
- Mute
- Subscribe to RSS Feed
- Permalink
- Report Inappropriate Content
Hi Frank,
If you want to have independent trend lines for some products but not others you might need to create a unique expression for each product using set analysis, or an expression for those with trend lines and one for those without.
Using a set analysis like:
Sum({<Product={'ProductA'}>} Measure)
Would produce a line showing the measure for Product A on which you can show a trend line. You can then make the expression invisible using the tick box on the Expressions tab, but the trend line will still show.
Probably not a complete solution but this might suggest a direction you can go in to get the results you want.
- Mark as New
- Bookmark
- Subscribe
- Mute
- Subscribe to RSS Feed
- Permalink
- Report Inappropriate Content
Adam
Thanks. I was able to get the trend line for the certain products for a given customer, but how can I get a national product trend line? I know where to add the trend, but I need some help on the calculation.
thanks
- Mark as New
- Bookmark
- Subscribe
- Mute
- Subscribe to RSS Feed
- Permalink
- Report Inappropriate Content
Perhaps look into something along the lines of Sum(TOTAL <Product> Measure) to take the sum of the measure over all products.
Sum(Measure) / Sum(TOTAL <Product> Measure) might give you what you want, though I haven't had time to test this out.