Unlock a world of possibilities! Login now and discover the exclusive benefits awaiting you.
- Qlik Community
- :
- All Forums
- :
- QlikView App Dev
- :
- Re: I Want To Do Different Charts
- Subscribe to RSS Feed
- Mark Topic as New
- Mark Topic as Read
- Float this Topic for Current User
- Bookmark
- Subscribe
- Mute
- Printer Friendly Page
- Mark as New
- Bookmark
- Subscribe
- Mute
- Subscribe to RSS Feed
- Permalink
- Report Inappropriate Content
I Want To Do Different Charts
Hi Friends
Here is my Sample Data
[Emp Id], [Emp Name], Department, LogDate, LogTime, Type, Start Time, End Time
101 , Raja, Mobile 20/7/15 10.00AM IN 9.00AM 6.00PM
102 , Ravi, Qv 20/7/15 10.00AM IN 9.00AM 6.00PM
101 , Raja, Mobile 20/7/15 6.00pM Out 9.00AM 6.00PM
103 , Krish, Qv 20/7/15 10.00AM IN 9.00AM 6.00PM
104 , Manu, Qv 20/7/15 10.00AM IN 9.00AM 6.00PM
105 , Sunil, Business 20/7/15 10.00AM IN 9.00AM 6.00PM
106 , Shiva, Office 20/7/15 10.00AM IN 9.00AM 6.00PM
102 , Ravi, Qv 20/7/15 6.00pm OUT 9.00AM 6.00PM
103 , Krish, Qv 20/7/15 8.00PM OUT 9.00AM 6.00PM
104 , Manu, QV 20/7/15 7.00PM OUT 9.00AM 6.00PM
105 , Sunil, Business 20/7/15 9.00PM OUT 9.00AM 6.00PM
106 , Shiva, Office 20/7/15 10.00PM OUT 9.00AM 6.00PM
107 , Deepak, Office 20/7/15 10.30AM IN 9.00AM 6.00PM
108 , Amar, Mobile 20/7/15 10.00AM IN 9.00AM 6.00PM
107 , Deepak, Mobile 20/7/15 5.00pm OUT 9.00AM 6.00PM
108 , Amar, Mobile 20/7/15 6.00pm OUT 9.00AM 6.00PM
My Aims
If you Click Emp ID I should get All the data About Emp name,his dept,how many times he was logged in and logged out,how much time he has worked in the day.All the Details of Data I should Show in the Presentation OF Different Charts.
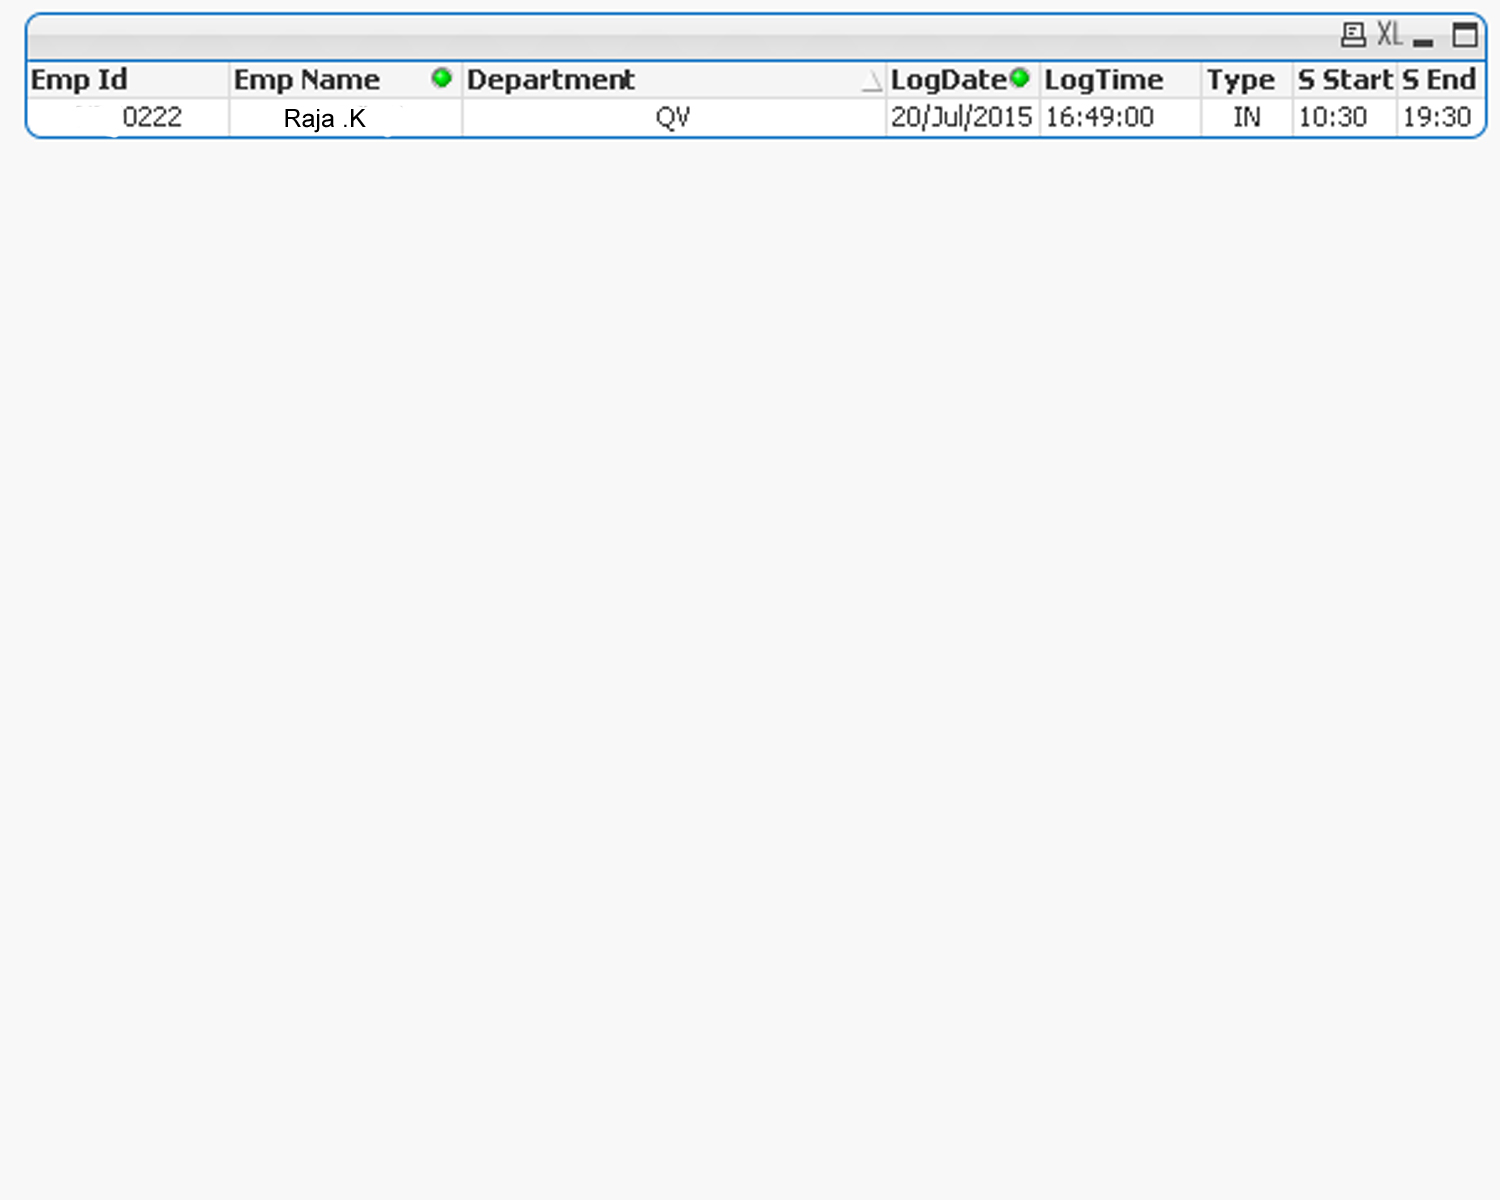
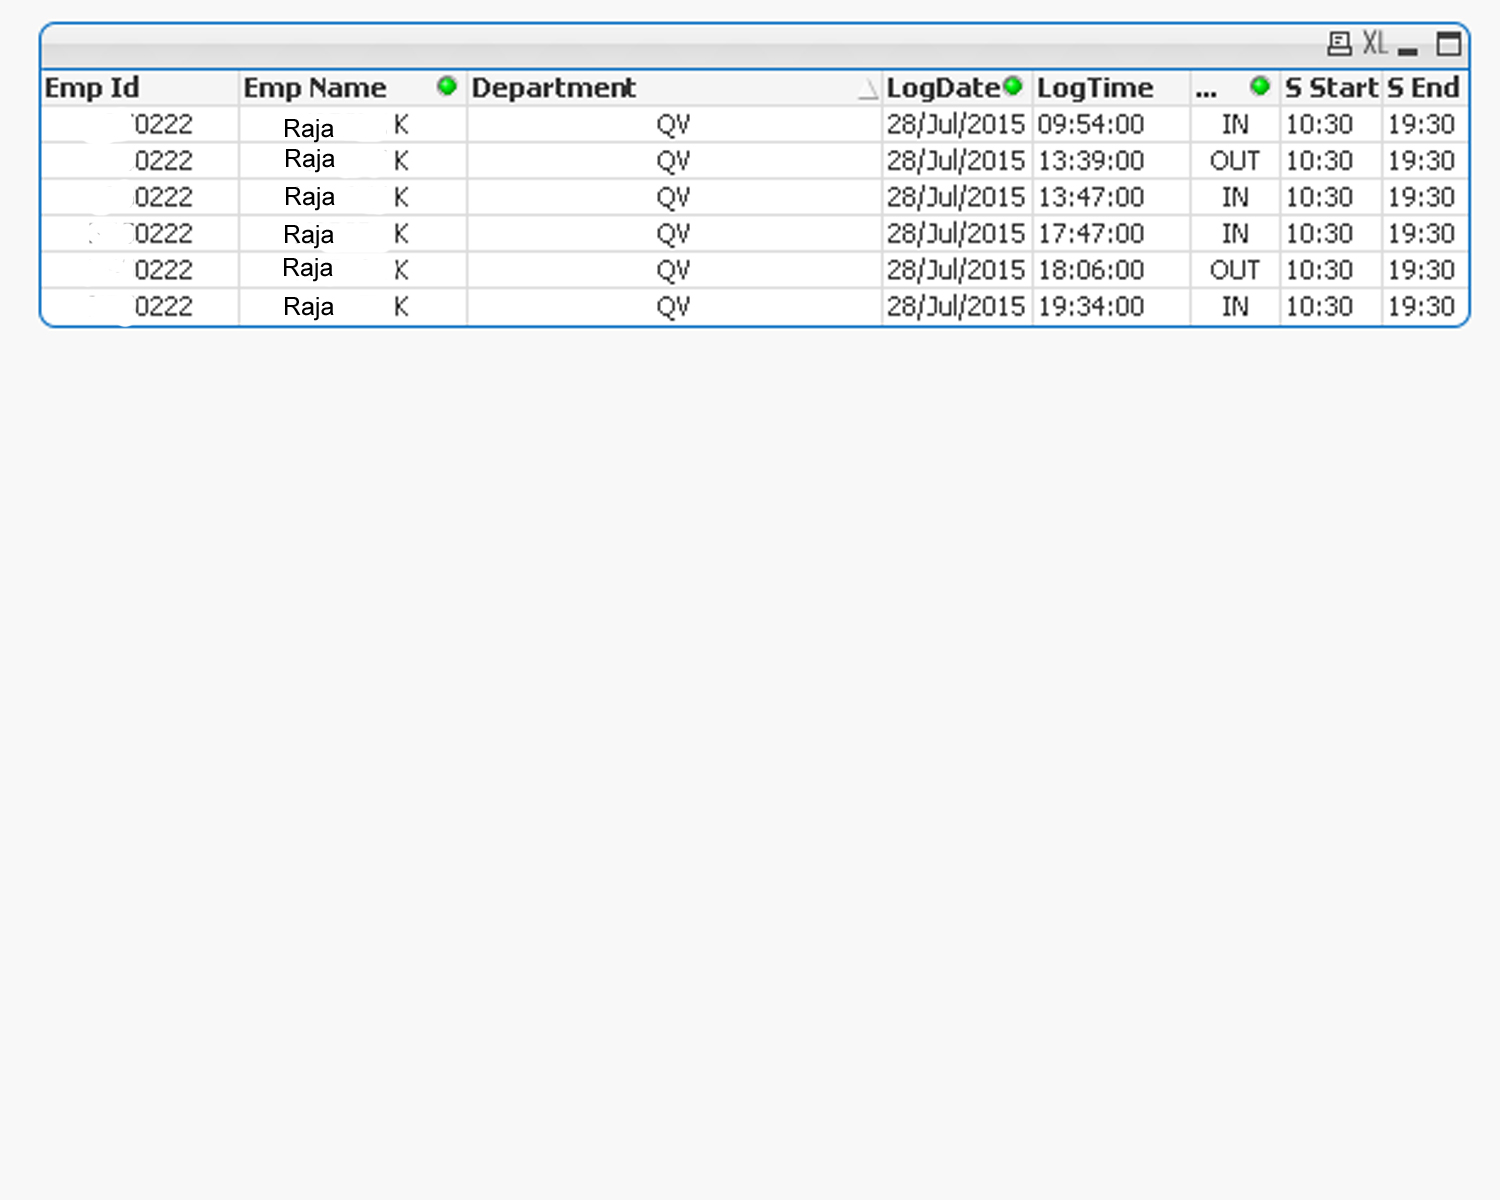
I Have Attached some sample preview
In 3rd screenshot it shows LogDate,lOGTIME AND Type .From this i should create charts..
I HAVE TRIED BUT I GOT THE DATA LIKE THIS BUT
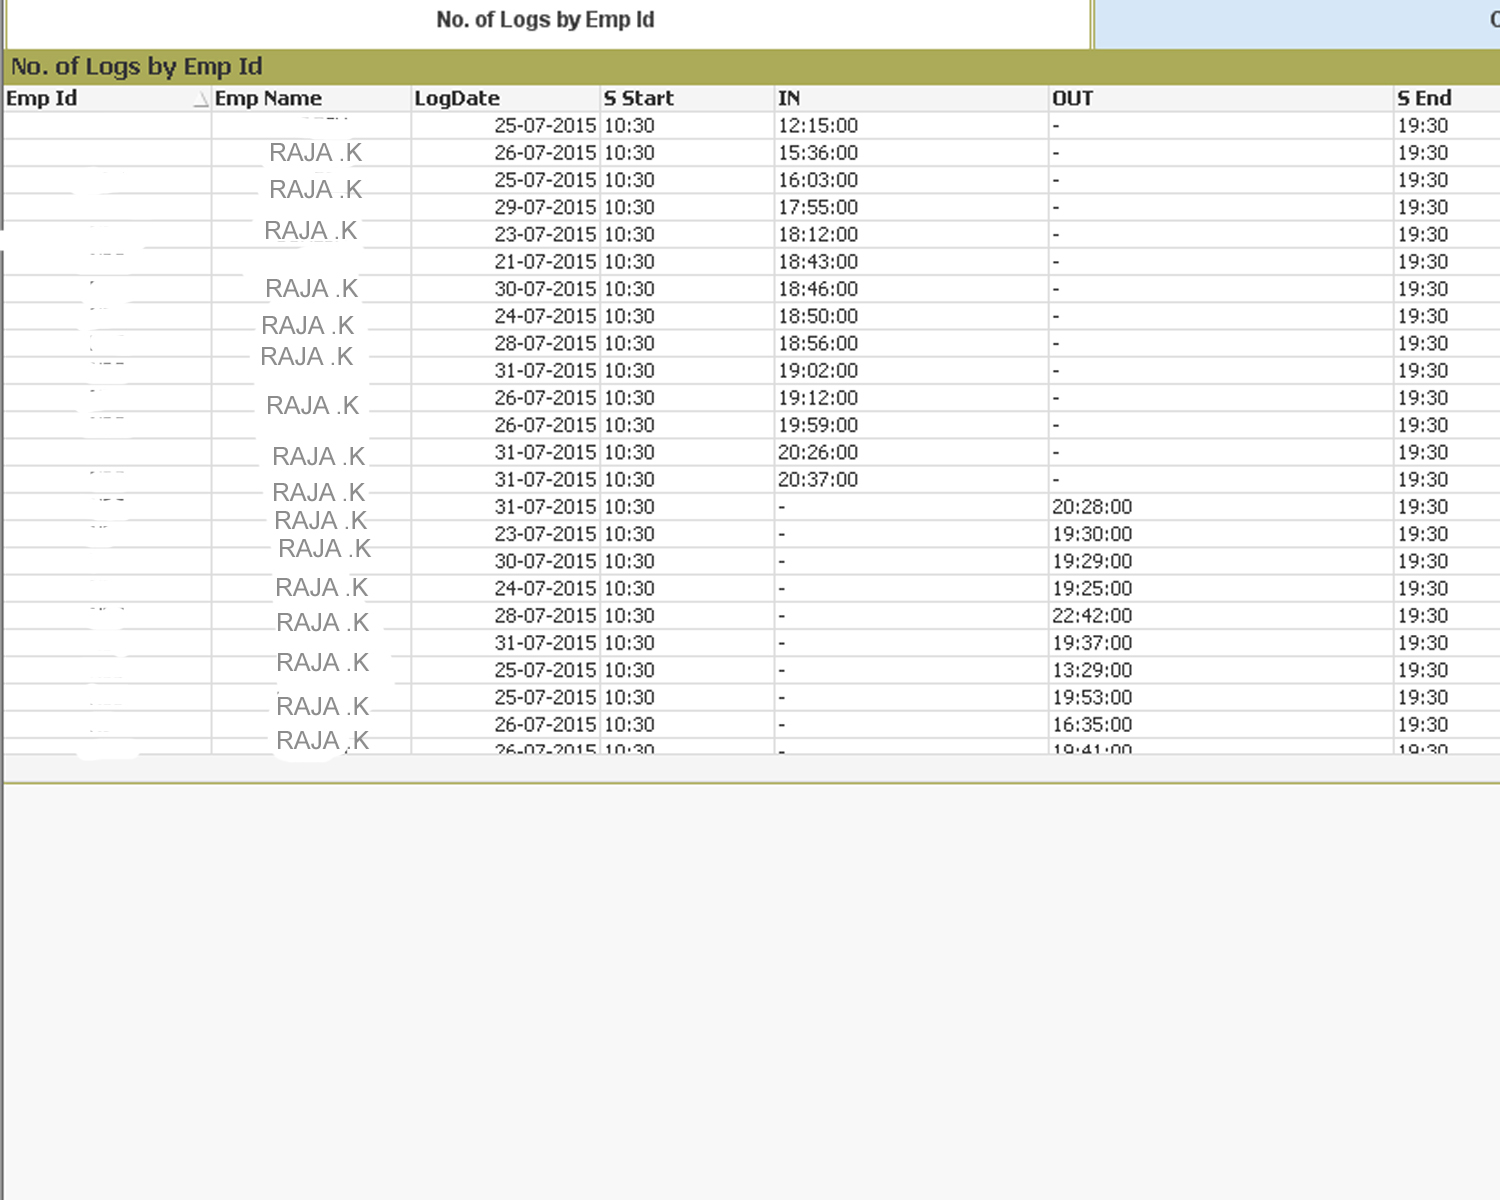
BUT I NEED DATA SHOULD COME IN ORDER LIKE THIS EXAMPLE SHOWN BELOW.I SHOULD GET IN TIME & OUT TIME SIDE BY SIDE IN THE TABLE.
[Emp Id], [Emp Name], Department, LogDate, LogTime, Type, Start Time, End Time
101 , Raja, Mobile 20/7/15 10.00AM IN 9.00AM 6.00PM
102 , Ravi, Qv 20/7/15 10.00AM IN 9.00AM 6.00PM
101 , Raja, Mobile 20/7/15 6.00pM Out 9.00AM 6.00PM
103 , Krish, Qv 20/7/15 10.00AM IN 9.00AM 6.00PM
Help ME Friends
sunindia hic New to QlikView massimo.morelli sunindia qlik4life Qlikwizard
- Mark as New
- Bookmark
- Subscribe
- Mute
- Subscribe to RSS Feed
- Permalink
- Report Inappropriate Content
Please explain your data in more detail. Users have more than one log entry in a day with the same start and end time and they sometimes do not tally with the IN/OUT log times.
- Mark as New
- Bookmark
- Subscribe
- Mute
- Subscribe to RSS Feed
- Permalink
- Report Inappropriate Content
I Need to show like this information in creating charts which have showed in 2nd image .All the log times information also i should show in the charts also .By Taking Emp Id as Dimension. I have taken Expression as Count (Logtime). But It is claculating Total logtime i don't need total logtime i need only particular Em Id Login and Logout data in charts.