Unlock a world of possibilities! Login now and discover the exclusive benefits awaiting you.
- Qlik Community
- :
- All Forums
- :
- QlikView App Dev
- :
- Identifying which cyclic group value is being view...
- Subscribe to RSS Feed
- Mark Topic as New
- Mark Topic as Read
- Float this Topic for Current User
- Bookmark
- Subscribe
- Mute
- Printer Friendly Page
- Mark as New
- Bookmark
- Subscribe
- Mute
- Subscribe to RSS Feed
- Permalink
- Report Inappropriate Content
Identifying which cyclic group value is being viewed?
Hi,
Is it possible to identify which cyclic group expression is currently being displayed?
If so, what is the correct syntax to apply?
------------------------------------------------------------------------------------------------------
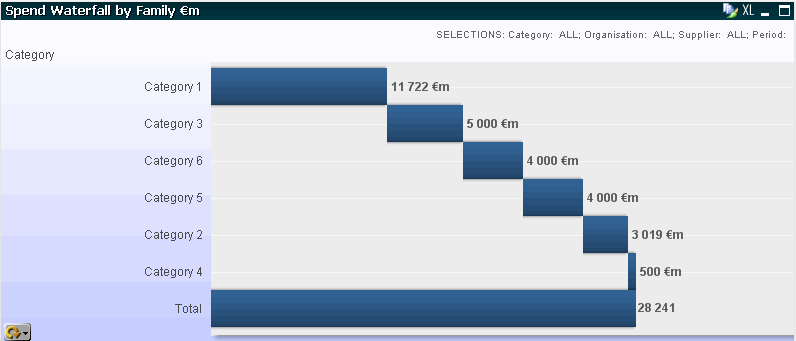
ie currently have following formula to sort my bars on a waterfall chart (for when cyclic group = Euros):
sum(Euros)

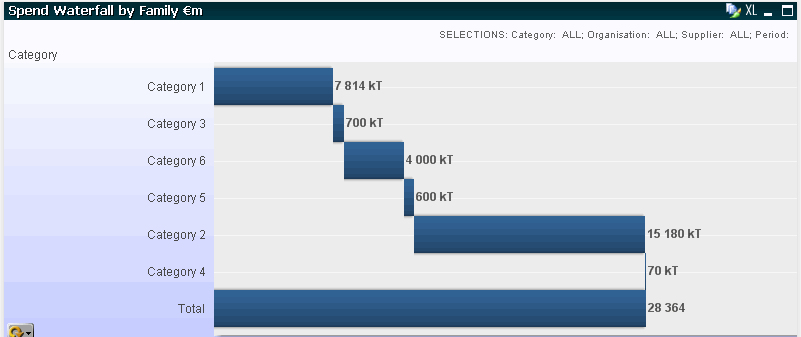
but would like this to change to sum(QtyKG) when cycled to display volumes, as currently it remains sorted on Euros (as per my definition):

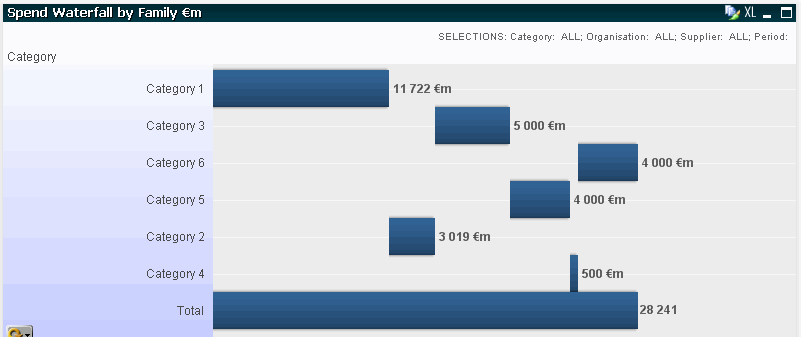
Have tried sorting using descending Y value, Numeric Value etc... but this then removes the "waterfall" effect (although displays in descending order).

the formula im currently using in the "Bar offset" to create the waterfall effect uses the "above" function:
If(rowno()=1,0,rangesum (above(sum(QtyKG),1,rowno()-1)))
------------------------------------------------------------------------------------------------------
Does anyone know a solution to change the expression in the sort by criteria to reflect the current cyclic group selection?
Any thoughts greatly appreciated,
Kind regards,
Rich
- Tags:
- new_to_qlikview
- « Previous Replies
-
- 1
- 2
- Next Replies »
- Mark as New
- Bookmark
- Subscribe
- Mute
- Subscribe to RSS Feed
- Permalink
- Report Inappropriate Content
Hi John,
Many thanks for your thoughts on the matter!
Managed to include an additional dimension that enables rotation between the two expressions - as per your suggestion, although for some reason, am unable to retain the original "waterfall" look, using the bar offset / above technique.
In the end, have decided to create multiple charts (one for each of the expressions), and then using a drop down listing to select/display the appropriate chart.
Kind regards,
Rich
- Mark as New
- Bookmark
- Subscribe
- Mute
- Subscribe to RSS Feed
- Permalink
- Report Inappropriate Content
Hi,
This might be a bit of a forgotten post, but I'll try nonetheless:
I am trying to create a Waterfall Chart that includes a Total Column to the side in QlikView 11, as shown in RichSheppard 's intial post. I have downloaded the example model, but it doesn't display the same as in the original post. Is that because QlikView 11 is handling the Total column differently? I am using the same expression for my Bar offset and the same expression for my sort order as RichSheppard. I also have a limit of top 10 set in the Dimension Limits section, while also showing 'Others'. Are all of these additional dimension functions screwing with the waterfall chart?
It seems like QlikView is not realising that Total is seperate to the other bars, so it is seeing it as one of the dimensions and offsetting it as well.
Do I need to change the Bar offset expression?
Please help!
Thanks!
- Mark as New
- Bookmark
- Subscribe
- Mute
- Subscribe to RSS Feed
- Permalink
- Report Inappropriate Content
Hi Hesten,
can you upload an example of your file, and then I'll have a look to see if it displays in v8.5 / see if I can "fix" it...
Kind regards,
Rich
- Mark as New
- Bookmark
- Subscribe
- Mute
- Subscribe to RSS Feed
- Permalink
- Report Inappropriate Content
Useful Post
Regards,
KC
- « Previous Replies
-
- 1
- 2
- Next Replies »