Unlock a world of possibilities! Login now and discover the exclusive benefits awaiting you.
- Qlik Community
- :
- All Forums
- :
- QlikView App Dev
- :
- Ignore certain selections in SET Analysis
- Subscribe to RSS Feed
- Mark Topic as New
- Mark Topic as Read
- Float this Topic for Current User
- Bookmark
- Subscribe
- Mute
- Printer Friendly Page
- Mark as New
- Bookmark
- Subscribe
- Mute
- Subscribe to RSS Feed
- Permalink
- Report Inappropriate Content
Ignore certain selections in SET Analysis
Hello All,
I have a bar chart with the following expression
Sum({<Markt={'N07C'},Region=, Area=, FBNum=, Product = {'VERT'},Year={'2018'}>}Sales)
/
Sum({<Markt={'N07C'},Region=, Area=, FBNum=,Product = {'VERT'}, APORegion.Jahr={'2018'}>}Sales_Total/Product_Count)
Here, i'm trying to ignore few selection from, verything works fine apart from FBNum. When there is an FBNum value selected the chart gives me Null Values.
Please, provide me some inputs if we need to use any other strategy to ignore this particular field.
- Mark as New
- Bookmark
- Subscribe
- Mute
- Subscribe to RSS Feed
- Permalink
- Report Inappropriate Content
Is there a sample you can share to show the issue?
- Mark as New
- Bookmark
- Subscribe
- Mute
- Subscribe to RSS Feed
- Permalink
- Report Inappropriate Content
Hello Sunny,
For some reson i'm not able to upload the app. I have tried from different browsers but after the upload i get no response. I will try in some other way.
In the mean time i have Screenshots to explain my problem better.
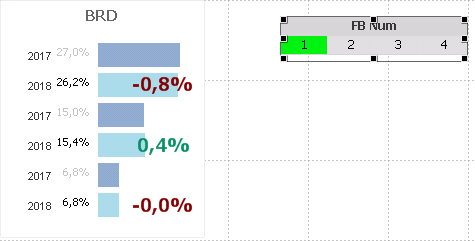
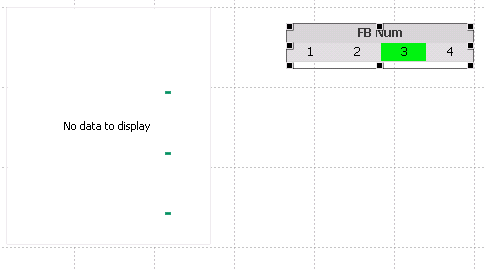
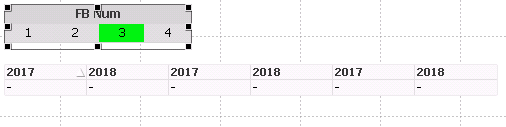
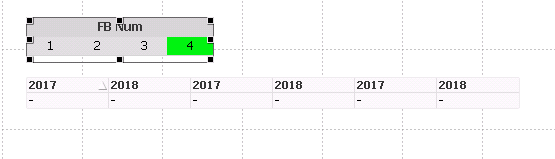
When i select the FB Num as 1 or 2 the Chart doesn't change(which is expected) But, when i select 3 and above it gives me a error as seen in the screen shot.
Thanks and Regards
Sai.
- Mark as New
- Bookmark
- Subscribe
- Mute
- Subscribe to RSS Feed
- Permalink
- Report Inappropriate Content
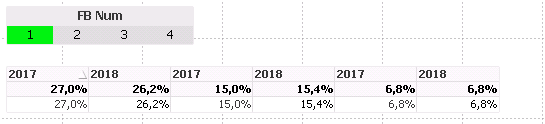
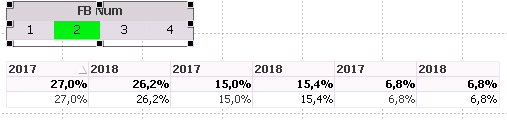
Can you convert this into a straight table and expand the column so that I can see the expression and dimension... don't add any labels to the expression or dimension.
- Mark as New
- Bookmark
- Subscribe
- Mute
- Subscribe to RSS Feed
- Permalink
- Report Inappropriate Content
- Mark as New
- Bookmark
- Subscribe
- Mute
- Subscribe to RSS Feed
- Permalink
- Report Inappropriate Content
Very strange, I am not sure I understand the reason behind this.... can we wait until the attachment comes through?
- Mark as New
- Bookmark
- Subscribe
- Mute
- Subscribe to RSS Feed
- Permalink
- Report Inappropriate Content
Yes, this is very strange. I'm trying to upload the sample and hopefully you can check it back soon.
- Mark as New
- Bookmark
- Subscribe
- Mute
- Subscribe to RSS Feed
- Permalink
- Report Inappropriate Content
Hello Sunny,
I just found out the reason for this behaviour.
Say i have 10 Regions in my dashboard and all the Regions have FB Num 1 & 2 upto now. So, when i select 1 or 2 the Bar Chart doesn't respond.
But, if i select 3 or 4 which is only present in few Regions then the Data fails and gives out an error.
I'm not sure if this is the ideal behaviour, but anyways atleast we know the reason.
Thank you for the help. Cheers!!