Unlock a world of possibilities! Login now and discover the exclusive benefits awaiting you.
- Qlik Community
- :
- All Forums
- :
- QlikView App Dev
- :
- Ignore selections on dimension
- Subscribe to RSS Feed
- Mark Topic as New
- Mark Topic as Read
- Float this Topic for Current User
- Bookmark
- Subscribe
- Mute
- Printer Friendly Page
- Mark as New
- Bookmark
- Subscribe
- Mute
- Subscribe to RSS Feed
- Permalink
- Report Inappropriate Content
Ignore selections on dimension
Hi All,
I have data from January 2015 to April 2016
I have created a line chart with different months and want to show all the months available irrespective of any selection except Year.
Dimesnsion : Month
Expression : If(Isnull(1-(Column1/Column2)),1,(1-(Column1/Column2)))
Case 1: If I select Year as 2015, I want to show all months(Jan - Dec) irrespective of any selection
Case 2 : If I select Year as 2016, I want to show only 4 Months (Jan - April) irrespective of any selection
on the dimension.
PS : Show all values will fail for Case 2 as it will show all the months and not only 4.
Also, there are no values for some Month - Year. Where it should display 1 as per the expression.
Regards,
Anjali Gupta
- « Previous Replies
- Next Replies »
Accepted Solutions
- Mark as New
- Bookmark
- Subscribe
- Mute
- Subscribe to RSS Feed
- Permalink
- Report Inappropriate Content
I think this is what you want, see the attached one -
- Mark as New
- Bookmark
- Subscribe
- Mute
- Subscribe to RSS Feed
- Permalink
- Report Inappropriate Content
What are your expressions for Column2 and Column2? Would you be able to share a sample?
- Mark as New
- Bookmark
- Subscribe
- Mute
- Subscribe to RSS Feed
- Permalink
- Report Inappropriate Content
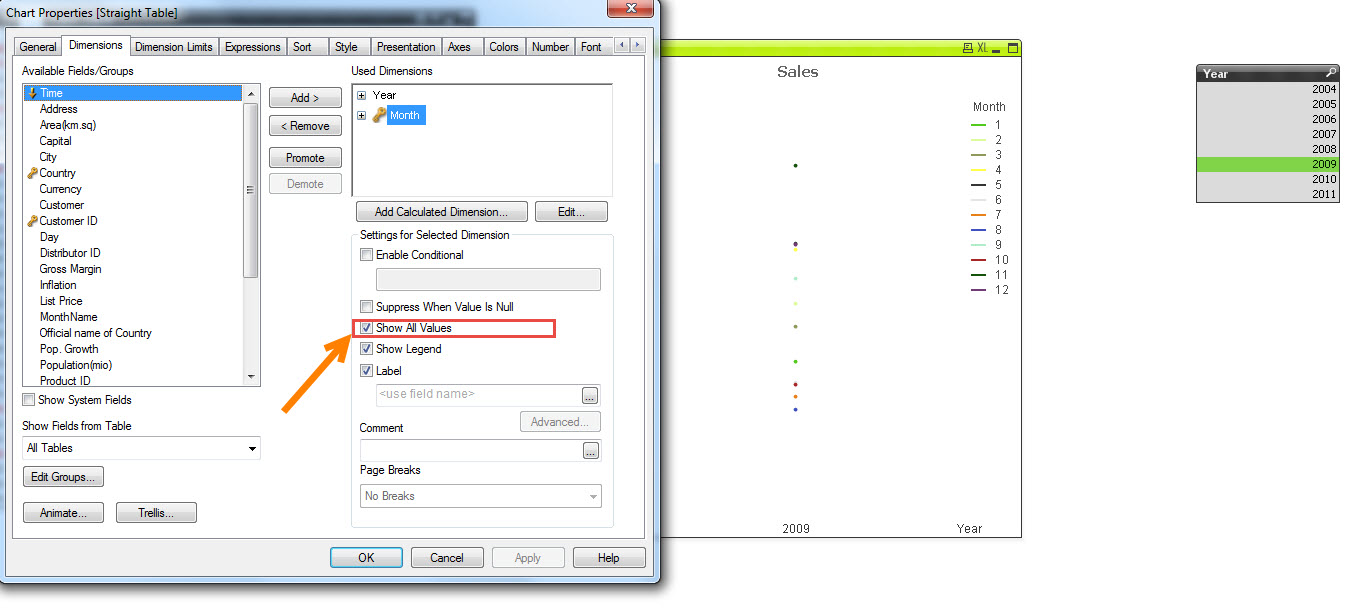
Try this option on Month
- Mark as New
- Bookmark
- Subscribe
- Mute
- Subscribe to RSS Feed
- Permalink
- Report Inappropriate Content
No Sunny, I can't share the sample because of security purpose and also its connected to different mapping sheets. So, might be confusing.
Regards,
Anjali Gupta
- Mark as New
- Bookmark
- Subscribe
- Mute
- Subscribe to RSS Feed
- Permalink
- Report Inappropriate Content
Hi Vikram,
As mentioned earlier, Show All values is showing all the months for Case 2 i.e. on selection of year 2016.
Regards,
Anjali Gupta
- Mark as New
- Bookmark
- Subscribe
- Mute
- Subscribe to RSS Feed
- Permalink
- Report Inappropriate Content
I guess I am unable to completely understand what you are wanting to do. That is why I was hoping for few rows of sample dummy data with the expected output on the chart.
- Mark as New
- Bookmark
- Subscribe
- Mute
- Subscribe to RSS Feed
- Permalink
- Report Inappropriate Content
Are you looking for something like this :
Sample Expression :
if( GetFieldSelections(Year) = '2016',sum({$<Month ={1,2,3,4}>} Sales),Sum(Sales))
if( GetFieldSelections(Year) = '2016',Sum({$<Month ={'January','February','March','April'}>} Sales),Sum(Sales))
- Mark as New
- Bookmark
- Subscribe
- Mute
- Subscribe to RSS Feed
- Permalink
- Report Inappropriate Content
Hi Sunny,
Say i have 2 fields in a mapping table
| Field1 | Field2 |
|---|---|
A | AA |
| B | BB |
| C | CC |
| D | DD |
| E | EE |
| F | FF |
| G | GG |
| H | HH |
| I | II |
| J | JJ |
| K | KK |
| L | LL |
Then I have a data table
with few Columns and Field2
Say
| UniqueID | Date | Column1 | Column2 | Field2 |
|---|---|---|---|---|
| 1 | 10-01-2015 | 45 | 1400 | AA |
| 2 | 23-06-2015 | 34 | 6400 | DD |
| 3 | 06-03-2016 | 24 | 3400 | HH |
| 4 | 17-08-2015 | 25 | 3540 | DD |
| 5 | 18-11-2015 | 45 | 4534 | CC |
| 6 | 27-01-2016 | 23 | 5675 | HH |
| 7 | 28-04-2016 | 45 | 4500 | BB |
With the Dates, I can say I have data from Jan-2015 to April 2016.
For all selection of Field1 [this is from mapping table] (Always One Selected) from a listbox, I want to show a trend (Line chart) for all the months.
If no data then 1 else 1-(Coulmn1/Column2) .
When i have checked Show All Values , the case 2 failed as mentioned above and shown data for May-2016 to December-2016. Which are future dates or data is yet to be received by me.
Hope this can make you help me..!!
Regards,
Anjali Gupta
- Mark as New
- Bookmark
- Subscribe
- Mute
- Subscribe to RSS Feed
- Permalink
- Report Inappropriate Content
Hi Vikram, Thanks for the quick response. But Is there any way to restrict it in the dimension itself ?
Regards,
Anjali Gupta
- Mark as New
- Bookmark
- Subscribe
- Mute
- Subscribe to RSS Feed
- Permalink
- Report Inappropriate Content
Creat a dummy dimension for month and use
if( GetFieldSelections(Year) = '2016' and Match(Month,1,2,3,4), Dummy Dimension,Original Dimension)
- « Previous Replies
- Next Replies »