Unlock a world of possibilities! Login now and discover the exclusive benefits awaiting you.
- Qlik Community
- :
- All Forums
- :
- QlikView App Dev
- :
- Re: Ignoring calculated dimensions in chart
- Subscribe to RSS Feed
- Mark Topic as New
- Mark Topic as Read
- Float this Topic for Current User
- Bookmark
- Subscribe
- Mute
- Printer Friendly Page
- Mark as New
- Bookmark
- Subscribe
- Mute
- Subscribe to RSS Feed
- Permalink
- Report Inappropriate Content
Ignoring calculated dimensions in chart
Hi All.
I have attached sample data in the excel file to explain what I am trying to do.
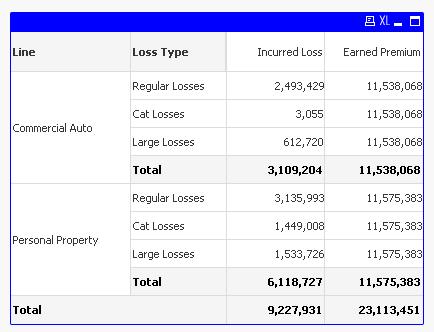
I am trying to create a chart that shows Incurred Loss and Earned Premium. The Incurred Loss works fine and is by Loss Type. But the Earned Premium should be at the Line level.
Loss Type is a calculated dimension. I have included my expressions in the excel file (as well as qvw).
For Earned Premium I used TOTAL <Line> but I am not sure how to ignore Loss Type which is a calculated dimension. The Earned Premium should be the total for the Line and repeat for all Loss Types.
Any help is appreciated.
Thanks
Shariq
Accepted Solutions
- Mark as New
- Bookmark
- Subscribe
- Mute
- Subscribe to RSS Feed
- Permalink
- Report Inappropriate Content
May be this
If(Dimensionality() = 0,
Sum({<Flag_YTD = {1}, Year = {'$(=max(Year))'}>} [Earned Premium]),
Aggr(NODISTINCT Sum({<Flag_YTD = {1}, Year = {'$(=max(Year))'}>} [Earned Premium]), Line))
- Mark as New
- Bookmark
- Subscribe
- Mute
- Subscribe to RSS Feed
- Permalink
- Report Inappropriate Content
Thanks Sunny! Exactly what I was looking for.