Unlock a world of possibilities! Login now and discover the exclusive benefits awaiting you.
- Qlik Community
- :
- All Forums
- :
- QlikView App Dev
- :
- Re: In bar chart $ symbol can't be prefixed to the...
- Subscribe to RSS Feed
- Mark Topic as New
- Mark Topic as Read
- Float this Topic for Current User
- Bookmark
- Subscribe
- Mute
- Printer Friendly Page
- Mark as New
- Bookmark
- Subscribe
- Mute
- Subscribe to RSS Feed
- Permalink
- Report Inappropriate Content
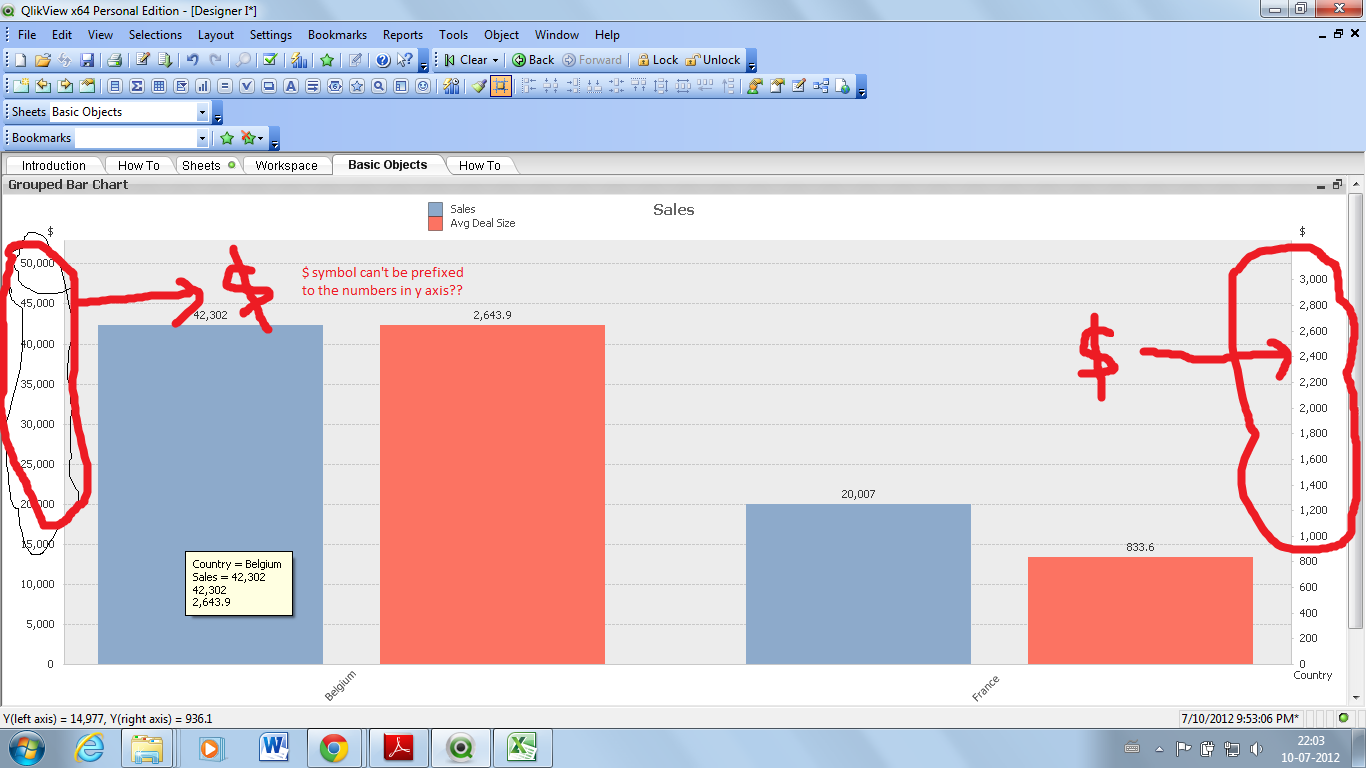
In bar chart $ symbol can't be prefixed to the numbers in y-axis?
Hi,
I am just wondering that don't we have option to put $ symbol to be prefixed infront of numbers in y-axis in bar charts.
Please find the attached document, if I am not clear.
Best Regards,
Shubham Kumar
- Mark as New
- Bookmark
- Subscribe
- Mute
- Subscribe to RSS Feed
- Permalink
- Report Inappropriate Content
Try changing the settings in the Number tab of the chart properties to Money and add $ in the Symbol box.
This adds $ sign on top of the y-axis and in the values on the data points.
- Mark as New
- Bookmark
- Subscribe
- Mute
- Subscribe to RSS Feed
- Permalink
- Report Inappropriate Content
Thanks for your reply. However I was able to achieve the solution which you have provieded. My question is only in y-axis, in front of all the number $ symbol should be coming. like $1000000, $ 2000000, $ 3000000 etc. is that possible. I have tried in changing the money format and other this like adding $ in format as well, but didn't work 
If you have any solution, please let me know.
thanks & regards
shubham
- Mark as New
- Bookmark
- Subscribe
- Mute
- Subscribe to RSS Feed
- Permalink
- Report Inappropriate Content
As previously suggested you can get the $ symbol at the top of the axis, but not against each value.
- Mark as New
- Bookmark
- Subscribe
- Mute
- Subscribe to RSS Feed
- Permalink
- Report Inappropriate Content
That's fine, I wanted to have against each value in the axis. Anyway's thanks for your clarification.
Best,
skumar
- Mark as New
- Bookmark
- Subscribe
- Mute
- Subscribe to RSS Feed
- Permalink
- Report Inappropriate Content
I've tried to sort that before with no luck.
Please mark an answer to close the thread.
Cheers,
Jason
- Mark as New
- Bookmark
- Subscribe
- Mute
- Subscribe to RSS Feed
- Permalink
- Report Inappropriate Content
When I added a value to the "Static Step" (in the Axis tab) for the Expression that's on the secondary Y-Axis, then the secondary Y-Axis on the chart picked up the number format of that Expression (from the Number tab).
Bug or feature? Not sure, but it seemed to work.
- Mark as New
- Bookmark
- Subscribe
- Mute
- Subscribe to RSS Feed
- Permalink
- Report Inappropriate Content
Good find Eric.
I've created a code snippet that you can put into the expression window for Static Step so that you still get a good-looking chart:
=round(max(aggr(<expression>,<dimension>))/<number of chart divisions>,5*pow(10,floor(log10(max(aggr(<expression>,<dimension>))))-1))
It's a good idea here to set your expression to a variable so that when you need to change the expression it's changed everywhere. For example, if you had a chart showing sum of sales by year, you'd do something like this:
Set veSumSales = num(sum(Sales),'$#,###,###') //Do this in script or just set it in the Variable Overview
For the chart expression, just use =$(veSumSales)
For the chart dimension, set it to Year
For the Static Step, assuming we want a 0 and three additional labels on the axis, in this example you would use:
=round(max(aggr($(veSumSales),Year))/3,5*pow(10,floor(log10(max(aggr($(veSumSales),Year))))-1))
In the event you have multiple expressions, you'd need to wrap each one up in a Max(Aggr(<expression>,<Dimension(s)>)) and then wrap that whole thing in a RangeMax function.
- Mark as New
- Bookmark
- Subscribe
- Mute
- Subscribe to RSS Feed
- Permalink
- Report Inappropriate Content
This is a great answer. Thanks