Unlock a world of possibilities! Login now and discover the exclusive benefits awaiting you.
- Qlik Community
- :
- All Forums
- :
- QlikView App Dev
- :
- Individual/Detailed Variances
- Subscribe to RSS Feed
- Mark Topic as New
- Mark Topic as Read
- Float this Topic for Current User
- Bookmark
- Subscribe
- Mute
- Printer Friendly Page
- Mark as New
- Bookmark
- Subscribe
- Mute
- Subscribe to RSS Feed
- Permalink
- Report Inappropriate Content
Individual/Detailed Variances
Hi Experts,
I have 2 datasets. One has generic info for each record. Another table is sort of a historical table showing which records exist for a particular time. This is identified with the Date field. In the example, I have data for January and February.
I've attached the working document here below.
I am able to successfully do a variance on the count of ID's for February versus January. This is good but it simply shows the net difference.
What I want to achieve is be able to something more granular. I would like to list down the actual ID's that are present in January but dropped out of February (in the example it is DEF456) as well as the actual ID's that were only added in February (i.e. in the example these are XYZ999 and XYZ123). And hopefully put them in separate Straight Tables (one for "Deleted" and one for "Added") where I can also pull the Rating and Type fields associated to those records.
Similar to added/removed ID's, I would also like to put in another Straight Table those ID's which are present in both dates but where the Size is different (i.e. ABC123 has a size of 1000 in January but a size of 2000 in February).
Any advice? I would assume the logic in the script would be similar for the above scenarios but really stumped after several attempts. Thanks for the help!!!
- « Previous Replies
-
- 1
- 2
- Next Replies »
Accepted Solutions
- Mark as New
- Bookmark
- Subscribe
- Mute
- Subscribe to RSS Feed
- Permalink
- Report Inappropriate Content
If this is always a comparison between 2 months, you can try like the attached
- Mark as New
- Bookmark
- Subscribe
- Mute
- Subscribe to RSS Feed
- Permalink
- Report Inappropriate Content
Is this what you are aiming for?
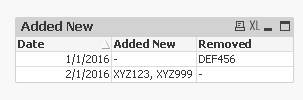
Expressions
1) Added New
=If(Date <> Min(TOTAL Date), Concat(Aggr(If(ID <> Above(ID), ID), ID, Date), ', '))
2) Removed
=If(Date <> Max(TOTAL Date), Concat(Aggr(If(ID <> Below(ID), ID), ID, Date), ', '))
- Mark as New
- Bookmark
- Subscribe
- Mute
- Subscribe to RSS Feed
- Permalink
- Report Inappropriate Content
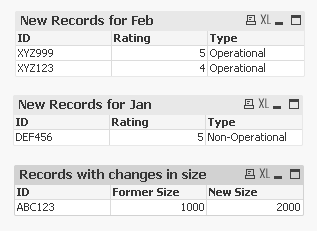
Sunny, thank you and this is very helpful. This solves listing which ones were dropped and added. However I was also trying to create a straight table where the dimensions are the individual ID's that were added and then pull in their Rating and Type similar to below:
NEW RECORDS FOR FEBRUARY:
| ID | Rating | Type |
|---|---|---|
| XYZ999 | 5 | Operational |
| XYZ123 | 4 | Operational |
And then for those records that were dropped the table would be:
RECORDS DELETED AFTER JANUARY:
| ID | Rating | Type |
|---|---|---|
| DEF456 | 5 | Non-Operational |
And then for records which are present in both dates but have a change in their Size, the table would be:
RECORDS WITH CHANGES IN SIZE
| ID | Former Size | New Size |
|---|---|---|
| ABC123 | 1000 | 2000 |
Is this doable? Thanks for the help.
- Mark as New
- Bookmark
- Subscribe
- Mute
- Subscribe to RSS Feed
- Permalink
- Report Inappropriate Content
If this is always a comparison between 2 months, you can try like the attached
- Mark as New
- Bookmark
- Subscribe
- Mute
- Subscribe to RSS Feed
- Permalink
- Report Inappropriate Content
Yes it would always be comparison of two months.
Amazing! This looks great! Thanks! Will play around with it and work with the script. But so far, this looks like exactly what I am looking for.
- Mark as New
- Bookmark
- Subscribe
- Mute
- Subscribe to RSS Feed
- Permalink
- Report Inappropriate Content
Did you get it to work for 3 month selection scenario? I was still working on it? Not needed anymore?
- Mark as New
- Bookmark
- Subscribe
- Mute
- Subscribe to RSS Feed
- Permalink
- Report Inappropriate Content
Thanks Sunny for reaching out. I was able to get help from another person and was able to resolve this. The straight tables have been updated (attached here for reference).
However, if you are able to help, I am trying to accomplish putting the total Size in a text box. I'm having trouble transforming the script from the Dimension of the Straight Table and using it for a text box showing the Sum(Size) of new records (i.e. records in max(date) but not in min(date)). It is not calculating anything and I think I am applying the AGGR function incorrectly.
So on the attached, if January through March are selected, the textbox should read 1850 (i.e. the total Size of XYZ999, XYZ123, and ZZZ999 from March). If January through February are selected, the textbox should read 1050 (i.e. the total Size of XYZ999, XYZ123 from February).
Would you be able to advise?
- Mark as New
- Bookmark
- Subscribe
- Mute
- Subscribe to RSS Feed
- Permalink
- Report Inappropriate Content
May be this:
=Sum(Aggr(If(Count({<Date={"$(=max(Date))"}>}DISTINCT ID) = 1 and Count({<Date={"$(=min(Date))"}>}DISTINCT ID) < 1, Sum({<Date = {"$(vMaxDate)"}>} Size)), ID))
- Mark as New
- Bookmark
- Subscribe
- Mute
- Subscribe to RSS Feed
- Permalink
- Report Inappropriate Content
Exactly what I was looking for. That's where I got stumped - I never considered applying two SUM functions. Thanks a bunch!!!
- Mark as New
- Bookmark
- Subscribe
- Mute
- Subscribe to RSS Feed
- Permalink
- Report Inappropriate Content
This should also work using set analysis search string concept:
=Sum({<Date = {"$(vMaxDate)"}, ID = {"=Count({<Date={'$(=max(Date))'}>}DISTINCT ID) = 1 and Count({<Date={'$(=min(Date))'}>}DISTINCT ID) < 1"}>} Size)
- « Previous Replies
-
- 1
- 2
- Next Replies »