Unlock a world of possibilities! Login now and discover the exclusive benefits awaiting you.
- Qlik Community
- :
- All Forums
- :
- QlikView App Dev
- :
- Is it possible to create "Default States"
- Subscribe to RSS Feed
- Mark Topic as New
- Mark Topic as Read
- Float this Topic for Current User
- Bookmark
- Subscribe
- Mute
- Printer Friendly Page
- Mark as New
- Bookmark
- Subscribe
- Mute
- Subscribe to RSS Feed
- Permalink
- Report Inappropriate Content
Is it possible to create "Default States"
Hello, is it possible to create a "default state" for charts, that will essentially be disregarded once a user has made a selection:
I have the following chart:
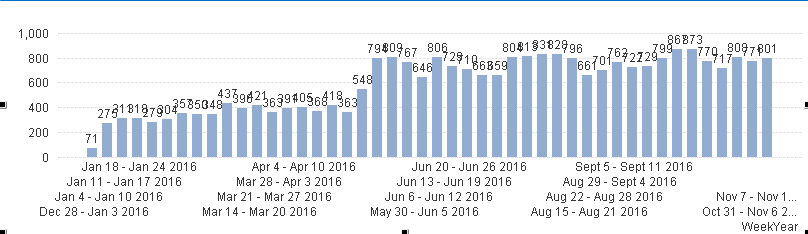
which depicts all of my WeekYear values until today. There's obviously too much in this picture to gather any good information from, so what I would like to do is have this represent the last X weeks, lets say 8, but when a user makes a selection on WeekYear, this isn't taken into consideration...
So if it presents the last 8 weeks by default, which I can do with Set Analysis,
but the user selects weeks 9 and 10, (the two weeks prior to this representation), the chart will display those two weeks.
- Mark as New
- Bookmark
- Subscribe
- Mute
- Subscribe to RSS Feed
- Permalink
- Report Inappropriate Content
Change your set modifier from {<....something.....>} to {1<....something....>} to make sure the expression will ignore any and all user selections (unless you explicitly re-enable them again in the ...something.... part). If you're using an aggregation function like max in the ....something.... part the add a set modifier {1} to that aggregation function too.
talk is cheap, supply exceeds demand
- Mark as New
- Bookmark
- Subscribe
- Mute
- Subscribe to RSS Feed
- Permalink
- Report Inappropriate Content
Hi Gysbert, adding 1 set modifier will not solve my issue. Adding 1 will make the chart static, regardless of what the user has selected.
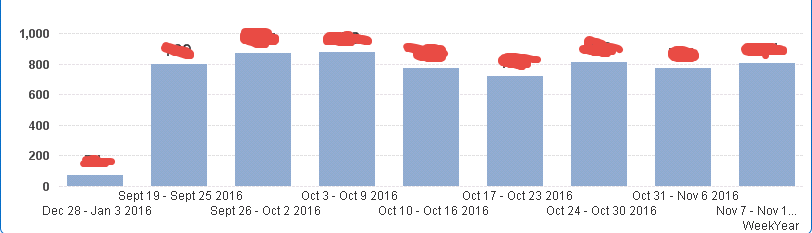
What I'm trying to do, is let the user select any date they wish, but without having the "default" chart they view be too cumbersome
Take the chart I attached for an example. There are ~46 weeks displayed on that graph. Can the user distinguish one week from another? No. They must make a selection in a list box, which will make the graph looks nice again. But, I would like the user to see, let's say, the last 4 weeks of data, but whenever they make a selection they could choose the last 16 weeks if they wished.
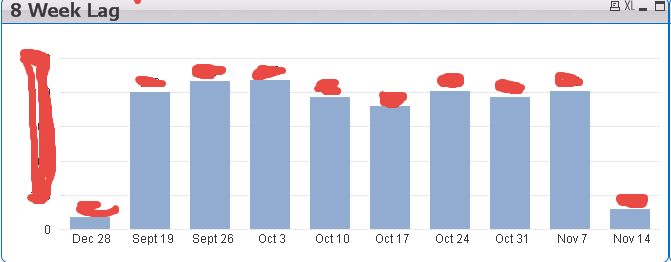
Currently, my SET ANALYSIS:
Model2.Week_Res={'>=$(=Week(Today(0))-8)<=$(=Week(Today(0)))'}
which displays an 8 WEEK LAG on a graph is consumable, but doesn't change as the user makes their own selection, unless that selection falls WITHIN that 8 week range
- Mark as New
- Bookmark
- Subscribe
- Mute
- Subscribe to RSS Feed
- Permalink
- Report Inappropriate Content
Ok, that's because you use today() which is always... well, today. Try something like
Model2.Week_Res={">=$(=max(Model2.Week_Res)-8)<=$(=max(Model2.Week_Res)"} instead which will reflect the user selection.
talk is cheap, supply exceeds demand
- Mark as New
- Bookmark
- Subscribe
- Mute
- Subscribe to RSS Feed
- Permalink
- Report Inappropriate Content
I should have realized that, lol
It's working, but for some reason my Week field has December 28 - Jan 3rd as my MAX(WEEK), with the week number being 53. Do you know why qlikview does this?
- Mark as New
- Bookmark
- Subscribe
- Mute
- Subscribe to RSS Feed
- Permalink
- Report Inappropriate Content
Qlik uses the ISO 8601 standard to calculate week numbers. The week with the first thursday of the year is week 1. That's why sometimes there's a week 53 in a year that contains the first few days of the next year.
talk is cheap, supply exceeds demand
- Mark as New
- Bookmark
- Subscribe
- Mute
- Subscribe to RSS Feed
- Permalink
- Report Inappropriate Content
I'm trying to exclude where CurYTDFlag = {'1'} and Week -= {'53'} to stop this
- Mark as New
- Bookmark
- Subscribe
- Mute
- Subscribe to RSS Feed
- Permalink
- Report Inappropriate Content
If you have a date field then that will probably work better than using the week number.
talk is cheap, supply exceeds demand
- Mark as New
- Bookmark
- Subscribe
- Mute
- Subscribe to RSS Feed
- Permalink
- Report Inappropriate Content
That doesn't resolve the issue...
- Mark as New
- Bookmark
- Subscribe
- Mute
- Subscribe to RSS Feed
- Permalink
- Report Inappropriate Content
Please post a small qlikview document that demonstrates the problem.
talk is cheap, supply exceeds demand