Unlock a world of possibilities! Login now and discover the exclusive benefits awaiting you.
- Qlik Community
- :
- All Forums
- :
- QlikView App Dev
- :
- Issue with Pie Chart
- Subscribe to RSS Feed
- Mark Topic as New
- Mark Topic as Read
- Float this Topic for Current User
- Bookmark
- Subscribe
- Mute
- Printer Friendly Page
- Mark as New
- Bookmark
- Subscribe
- Mute
- Subscribe to RSS Feed
- Permalink
- Report Inappropriate Content
Issue with Pie Chart
HI QV Experts,
stalwar1- Would you please help on this issue. Appreciate it 
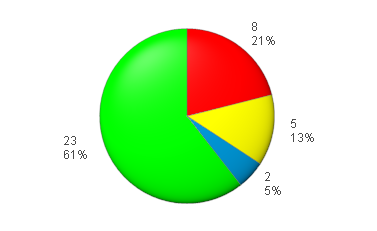
I have a pie chart. The strange thing that i notice is that the red portion of the pie does not react when i click on it. The other portions of the pie works just fine except the red portion which has 21%.
I have a calculated dimension which is as follows.
=if(FRCA_Totaldays > 90 , 'Low (>90days)',
if(FRCA_Totaldays > 30 and FRCA_Totaldays <=90 , 'Medium (30 to 90 days)',
if(FRCA_Totaldays <= 30 , 'High (<30days)','Never Loggedin')))
what is not working is the last condition 'Never Loggedin'. Even when i put a condition to calculate never logged in, no luck.
The expression that i have for it is as follows.
=count(FRCA_Activity)/count(total FRCA_Activity)
But there is another pie with similar condition and it works just fine.
Attached is the pie chart.
Thanks for your help
- « Previous Replies
-
- 1
- 2
- Next Replies »
- Mark as New
- Bookmark
- Subscribe
- Mute
- Subscribe to RSS Feed
- Permalink
- Report Inappropriate Content
may be if(FRCA_Totaldays <= 30 , 'High (<30days)','Never Loggedin'))) will have every low value.
some it wont show if you move the cursor the red part will blink
pls share your file
- Mark as New
- Bookmark
- Subscribe
- Mute
- Subscribe to RSS Feed
- Permalink
- Report Inappropriate Content
what is the condition for never logged in because you have covered <=30,>30 < =90 and >90 , which almost covers everything except if it is null.
please elaborate a bit. it will be hard without the details and what do you mean when you say it is working for another chart ?
- Mark as New
- Bookmark
- Subscribe
- Mute
- Subscribe to RSS Feed
- Permalink
- Report Inappropriate Content
Hi PRadosh,
The condition for never logged is this
if(FRCA_Totaldays= blank, 'Never Loggedin'. I tried that also but no luck.
- Mark as New
- Bookmark
- Subscribe
- Mute
- Subscribe to RSS Feed
- Permalink
- Report Inappropriate Content
Try This
IF(LEN(TRIM(FRCA_Totaldays))=0,'Never Loggedin',if(FRCA_Totaldays > 90 , 'Low (>90days)',
if(FRCA_Totaldays > 30 and FRCA_Totaldays <= 90 , 'Medium (30 to 90 days)',
if(FRCA_Totaldays <= 30 , 'High (<30days)'))))
- Mark as New
- Bookmark
- Subscribe
- Mute
- Subscribe to RSS Feed
- Permalink
- Report Inappropriate Content
Hi Pradosh,
No luck unfortunately 
Still the red portion does not react upon clicking
Thanks
- Mark as New
- Bookmark
- Subscribe
- Mute
- Subscribe to RSS Feed
- Permalink
- Report Inappropriate Content
You wont be able to select null. That is the issue it seems.May be some other expert can shed more light into this .
- Mark as New
- Bookmark
- Subscribe
- Mute
- Subscribe to RSS Feed
- Permalink
- Report Inappropriate Content
This might be stupid and I might be make it over simple, but is it possible you have an invisible object on top of your chart where you have the red part in your pie chart? May be try to move the chart to a brand new tab and see if it works.
- Mark as New
- Bookmark
- Subscribe
- Mute
- Subscribe to RSS Feed
- Permalink
- Report Inappropriate Content
Thanks Sunny.
I moved the chart to a new sheet but still no luck. ATtached is another chart where i have similar dimension and the red part works just fine. May be you will get some idea if you see this.
Dimension used in the working chart
=If ([Fill Rate-Category]= 'High', 'High >90%',
If ([Fill Rate-Category]= 'Medium', 'Medium 80% to 90%',
If ([Fill Rate-Category]= 'Low', 'Low <80%', 'Never Loggedin')))
Expression used in working chart
=count([Fill Rate-Category])
Thanks to help me on this
- Mark as New
- Bookmark
- Subscribe
- Mute
- Subscribe to RSS Feed
- Permalink
- Report Inappropriate Content
This won't really give me any idea.... your dimension and expression don't seem to say anything either... would you be able to post a trimmed down version of your qvw file?
Preparing examples for Upload - Reduction and Data Scrambling
- « Previous Replies
-
- 1
- 2
- Next Replies »