Unlock a world of possibilities! Login now and discover the exclusive benefits awaiting you.
- Qlik Community
- :
- All Forums
- :
- QlikView App Dev
- :
- Issue with calculated dimension and chart color
- Subscribe to RSS Feed
- Mark Topic as New
- Mark Topic as Read
- Float this Topic for Current User
- Bookmark
- Subscribe
- Mute
- Printer Friendly Page
- Mark as New
- Bookmark
- Subscribe
- Mute
- Subscribe to RSS Feed
- Permalink
- Report Inappropriate Content
Issue with calculated dimension and chart color
Hi Experts,
I am trying to create a chart with a calculated dimension but for some reason i am not getting the desired output.
Here are the challenges i face.
1) All values in the dimension does not show up on the chart
2) The color expression does not work and i see the entire pie chart in black color
3) The legends are not correct as per the numbers
Attached is the data and my qvw file.
Appreciate your help.
Thanks
Accepted Solutions
- Mark as New
- Bookmark
- Subscribe
- Mute
- Subscribe to RSS Feed
- Permalink
- Report Inappropriate Content
- Mark as New
- Bookmark
- Subscribe
- Mute
- Subscribe to RSS Feed
- Permalink
- Report Inappropriate Content
Because your activity and total days are not having one to many.. but many to many relationship..
For Medium and Low activity, you have Medium (30 to 90 Days)
For Inactive Activity you have High and Low both..
So your if statement can't recognise which segment should be given which colour.
Add Activity in your dimension so that you can understand what the issue is.
- Mark as New
- Bookmark
- Subscribe
- Mute
- Subscribe to RSS Feed
- Permalink
- Report Inappropriate Content
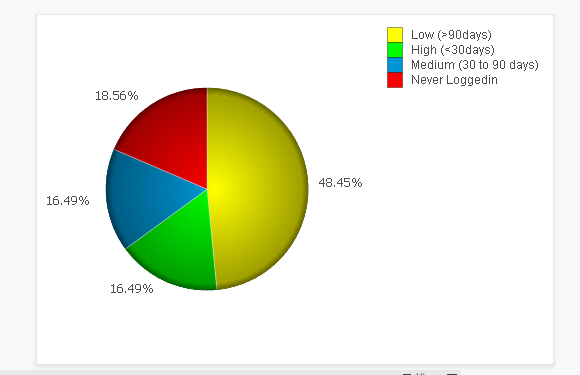
Is this what you are looking to get?
- Mark as New
- Bookmark
- Subscribe
- Mute
- Subscribe to RSS Feed
- Permalink
- Report Inappropriate Content
Appreciate your help Sunny. This is what i need.
Have a gr8 rest of your day 
- Mark as New
- Bookmark
- Subscribe
- Mute
- Subscribe to RSS Feed
- Permalink
- Report Inappropriate Content
Hi Sunny,
Can you please share your expression for the above problem statement?
I too have same doubt for coloring a calculated dimension.
Regards,
Rahul