Unlock a world of possibilities! Login now and discover the exclusive benefits awaiting you.
- Qlik Community
- :
- All Forums
- :
- QlikView App Dev
- :
- Re: Labels at bottom in Bar Charts?
- Subscribe to RSS Feed
- Mark Topic as New
- Mark Topic as Read
- Float this Topic for Current User
- Bookmark
- Subscribe
- Mute
- Printer Friendly Page
- Mark as New
- Bookmark
- Subscribe
- Mute
- Subscribe to RSS Feed
- Permalink
- Report Inappropriate Content
Labels at bottom in Bar Charts?
Hello everybody,
greetings from Buenos Aires, Argentina.
I have a question to ask you:
When I create a Bar Chart, the Expression Labels are always placed on the right of the graph window. It is, obviously, the default.
I want to place the labels on the bottom of the window, just below the x-axis, as showed, for instance, in the Movies Database sample dashboard, in the "Average length of Movies over time" graph.
However, I am unable to find the way to place these labels at the bottom (actually, the way to place them anywhere).
Even though after having studied in detail that sample graph, I can not discover how to do this.
Can anyone help me?
My Qlikview version is 11.20.
Thanks in advance!
Regards,
Rodrigo.
Accepted Solutions
- Mark as New
- Bookmark
- Subscribe
- Mute
- Subscribe to RSS Feed
- Permalink
- Report Inappropriate Content
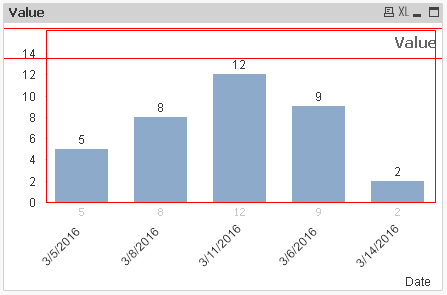
If my understanding is correct, hope the below will be helpful for you.
In order to move the header "Value" from top right (as shown in below image) to wherever you want, after selecting the chart press Ctrl + Shift key together and you will get the red lines as shown in the image then you can move around / resize the header, bar graph.
- Mark as New
- Bookmark
- Subscribe
- Mute
- Subscribe to RSS Feed
- Permalink
- Report Inappropriate Content
Thank you a lot, Gajapathy. The Ctrl + Shift trick is exactrly what I was looking for.
Best regards,
Rodrigo.
- Mark as New
- Bookmark
- Subscribe
- Mute
- Subscribe to RSS Feed
- Permalink
- Report Inappropriate Content
If you are looking for this answer, can you mark this as answered, so that others can make use of it.
- Mark as New
- Bookmark
- Subscribe
- Mute
- Subscribe to RSS Feed
- Permalink
- Report Inappropriate Content
you are welcome.